

This page is a translation of the original French text. It may contain errors; the French version is the reference text: Midterms 2026 : les clés du scrutin
Why each race tips: Le Millénaire’s electoral, cartographic and political analysis
Louisiana, which Donald Trump carried by 22.0 points in 2024: that is where the 51st Senate seat will be decided. In the House, the majority runs through Virginia’s 2nd district, which he won by 0.3 point. The Le Millénaire forecast gives Democrats a 76.7% chance of winning back the House, but only a 42.4% chance of controlling the Senate. William Thay, Sean Scull and Augustin Bataille explain why each race tips, and what links the three sets of elections on November 3.

Two maps
House: a 76.7% chance for Democrats, with 228 seats expected for a 218-seat majority. Senate: only 42.4%. The 218th seat is in a district Trump won by 0.3 point, the 51st in Louisiana, which he won by 22.0 points.
A cautious model
The model corrects for the underestimation of Republicans observed in the 2006 to 2022 midterm elections. On the polls alone, Democrats would have 53 Senate seats and 242 House seats.
Everything is linked
The most likely outcome, narrowly, is a Democratic Congress, with both chambers going to Democrats in 40.5% of simulations. With the House, Democrats have a 52.8% chance in the Senate; without it, 8.5%. With a polling error like 2020 or 2024, Republicans would keep the House more than eight times out of ten.
Foreword
On November 3, 2026, 435 House seats, 35 Senate seats and 36 governorships are at stake. The Le Millénaire forecast gives Democrats a 76.7% chance of winning back the House. By contrast, it gives them only a 42.4% chance of controlling the Senate.
The question we will ask is the following: how can voters who disapprove of Donald Trump hand the House back to Democrats while leaving the Senate to Republicans? And what tips Texas, Maine, Louisiana or Virginia’s 2nd district? The House, the Senate and the governors each also have their own in-depth note.
The figures come from the Le Millénaire forecast, in its October 31, 2026 update: 200,000 simulations of the election, based on polls, past results in each state and each district, campaign money and a few structural factors. Five pollsters, called into question over fabricated figures or hidden sponsors, have been removed from all calculations.
First, we look at what is at stake on November 3, Donald Trump’s unpopularity and the 2024 map. Second, at the 2.3-point correction the model applies to Democrats and at six mechanisms that tip races. Third, at the links between the three sets of elections, before a few benchmarks for election night.
What is at stake on November 3
Three elections, three majorities. Republicans currently control both chambers of Congress. In the House, they hold 218 seats to 214 for Democrats, and two seats are vacant; taking into account Florida’s vacant Democratic seat, Democrats are three net seats short of 218. In the Senate, Republicans hold 53 seats, against 45 Democrats and 2 independents who vote with them. Of the 35 seats up, including two special elections in Ohio and Florida, Republicans are defending 22 and Democrats 13, and Democrats need four net seats, since in a 50-50 tie Vice President J.D. Vance’s vote gives Republicans the majority. As for governors, they are being elected in 36 states, while Republicans currently lead 26 of the 50 states.
Divided government is commonplace, but it matters. In the United States, the election falls in the middle of the president’s term, and divided government is commonplace. Nevertheless, it complicates the exercise of power: the House holds “the power of the purse” and can initiate impeachment proceedings; the Senate confirms judicial and executive branch nominations.
History works against the president’s party. From 1946 to 2022, it lost an average of 25.8 House seats in midterm elections, and 37 when the president’s approval is below 50%. The Senate follows this rule less closely, because the list of seats up for election often matters as much as the national climate: in 2018, Democrats gained 41 House seats, while Republicans gained two Senate seats.
A national climate unfavorable to the president. Donald Trump enters the final week of the campaign at the lowest point of his two terms, with the Decision Desk HQ average putting him at 38.3% favorable and 60.3% unfavorable. The slide is sharpest on the economy, with AP-NORC measuring only 26% approval, and 17% on the cost of living. Gasoline has reached $4.28 a gallon, up $1.20 from a year ago, as a result of the war against Iran and the blockade of the Strait of Hormuz. There are also tariffs, the conduct of the immigration police, ICE, three shutdowns in one year and the expiration of the enhanced Obamacare subsidies.
lost on average in the House by the president’s party in midterm elections, from 1946 to 2022. It gained ground there only twice, in 1998 and 2002.
The generic ballot, and why we correct it
The generic ballot is the question asking voters which party they will choose for the House, without any candidate names. In our average among likely voters, before any correction, Democrats led by 6.1 points on August 1 and by 7.2 points on October 31. Nate Silver’s Silver Bulletin goes further, at 9 points.
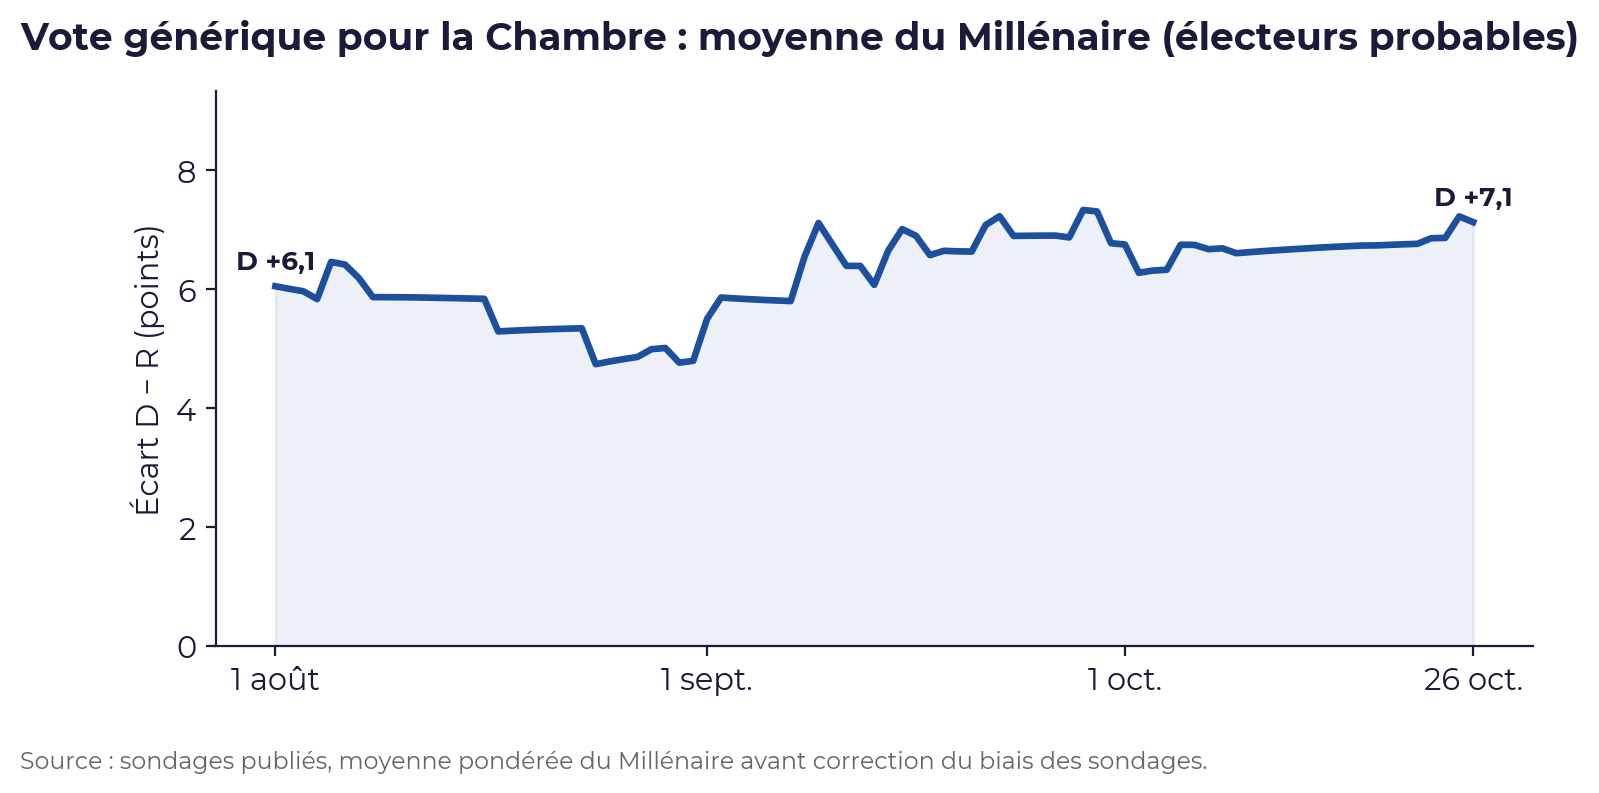
Yet in the last five midterm elections, polls published 45 days before the vote always overestimated Democrats. The error was only 0.2 points in 2018, but it reached 3.2 points in 2010, 3.9 points in 2014 and 4.5 points in 2022. The model therefore removes part of this average error from the generic ballot, before translating the result into a national climate that is added to each district.
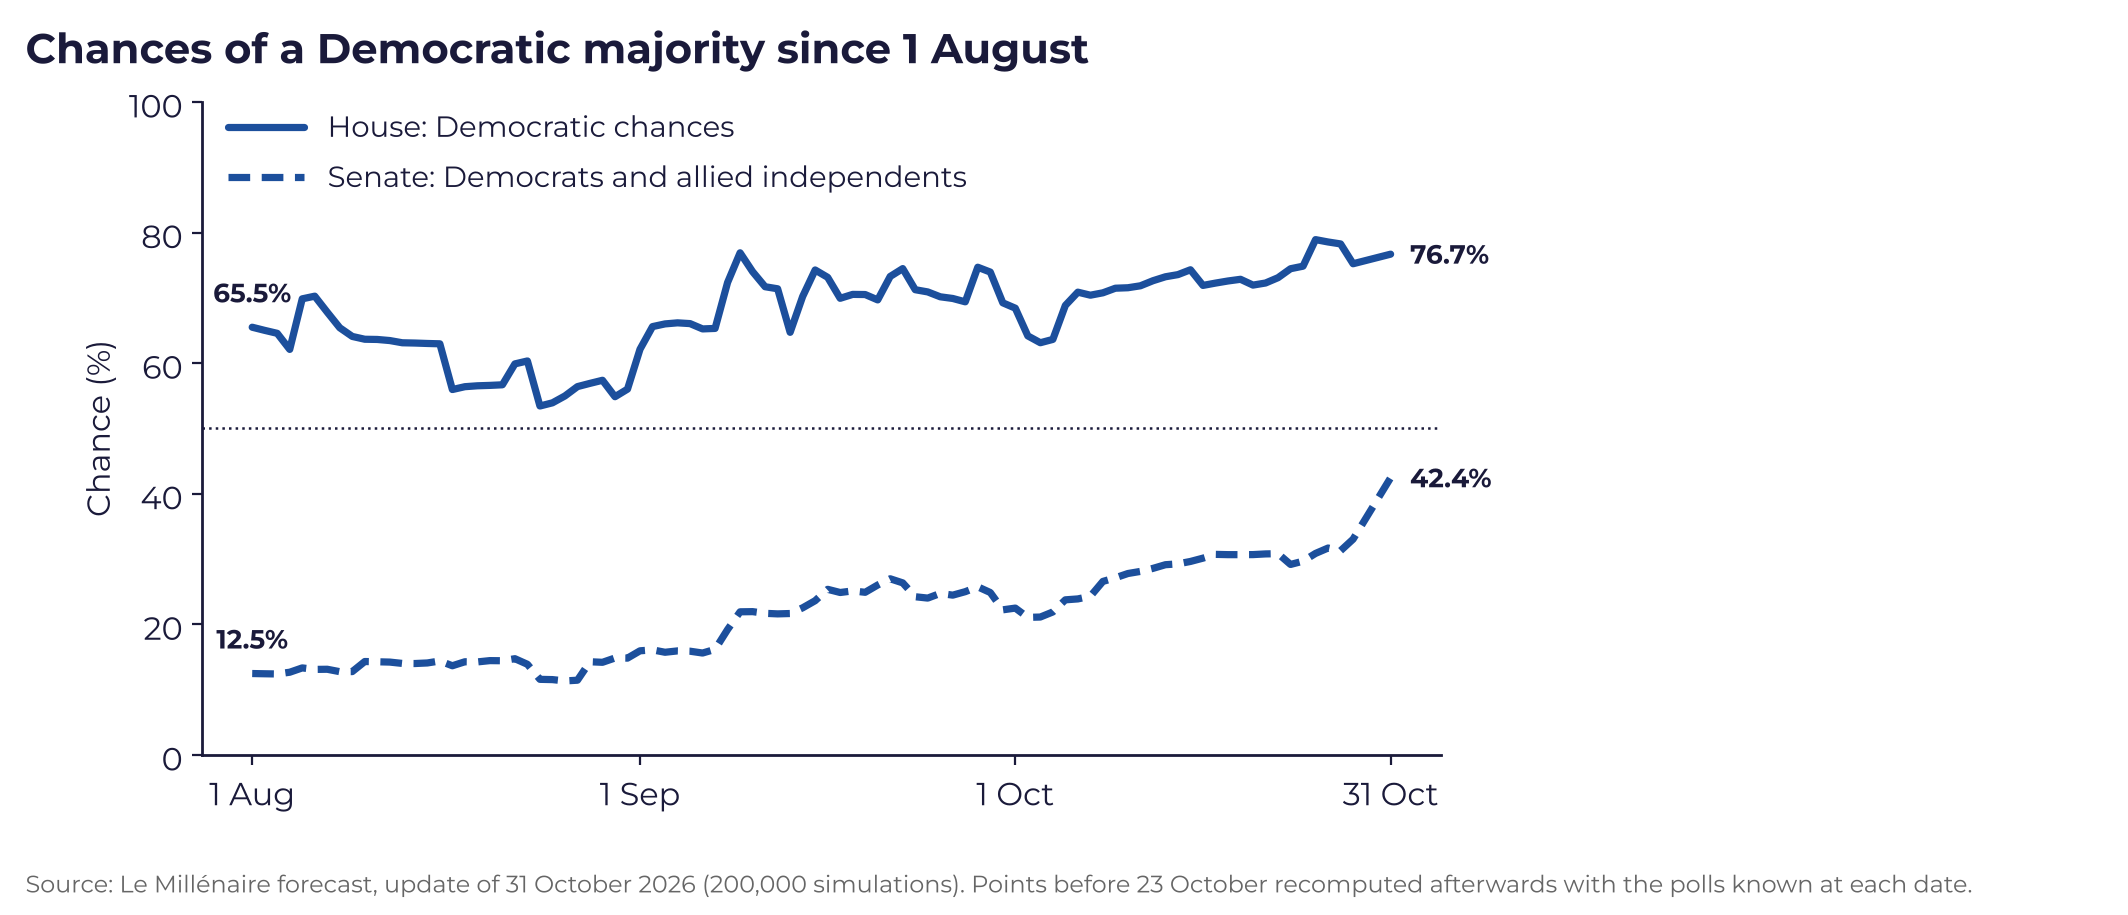
Since August 1, Democratic chances have risen from 65.5% to 76.7% in the House and from 12.5% to 42.4% in the Senate. The House tracks the generic ballot, while the Senate has moved faster, as state polls have improved for Democrats more quickly than the national climate: in Michigan, Abdul El-Sayed’s chances rose from 46% to 65%, in Texas James Talarico’s from 32% to 51%, in Alaska Mary Peltola’s from 8% to 19% and in Kansas Adam Hamilton’s from 2% to 22%.
The 2024 map, the starting point for 2026
Everything starts from 2024, when Donald Trump won the White House and majorities in both chambers by gaining ground in almost every county in the country. It is this vote that our model, like most American models, takes as its starting point: a district or a state is first judged on its recent presidential vote, then corrected for its own specific features and for the year’s climate.
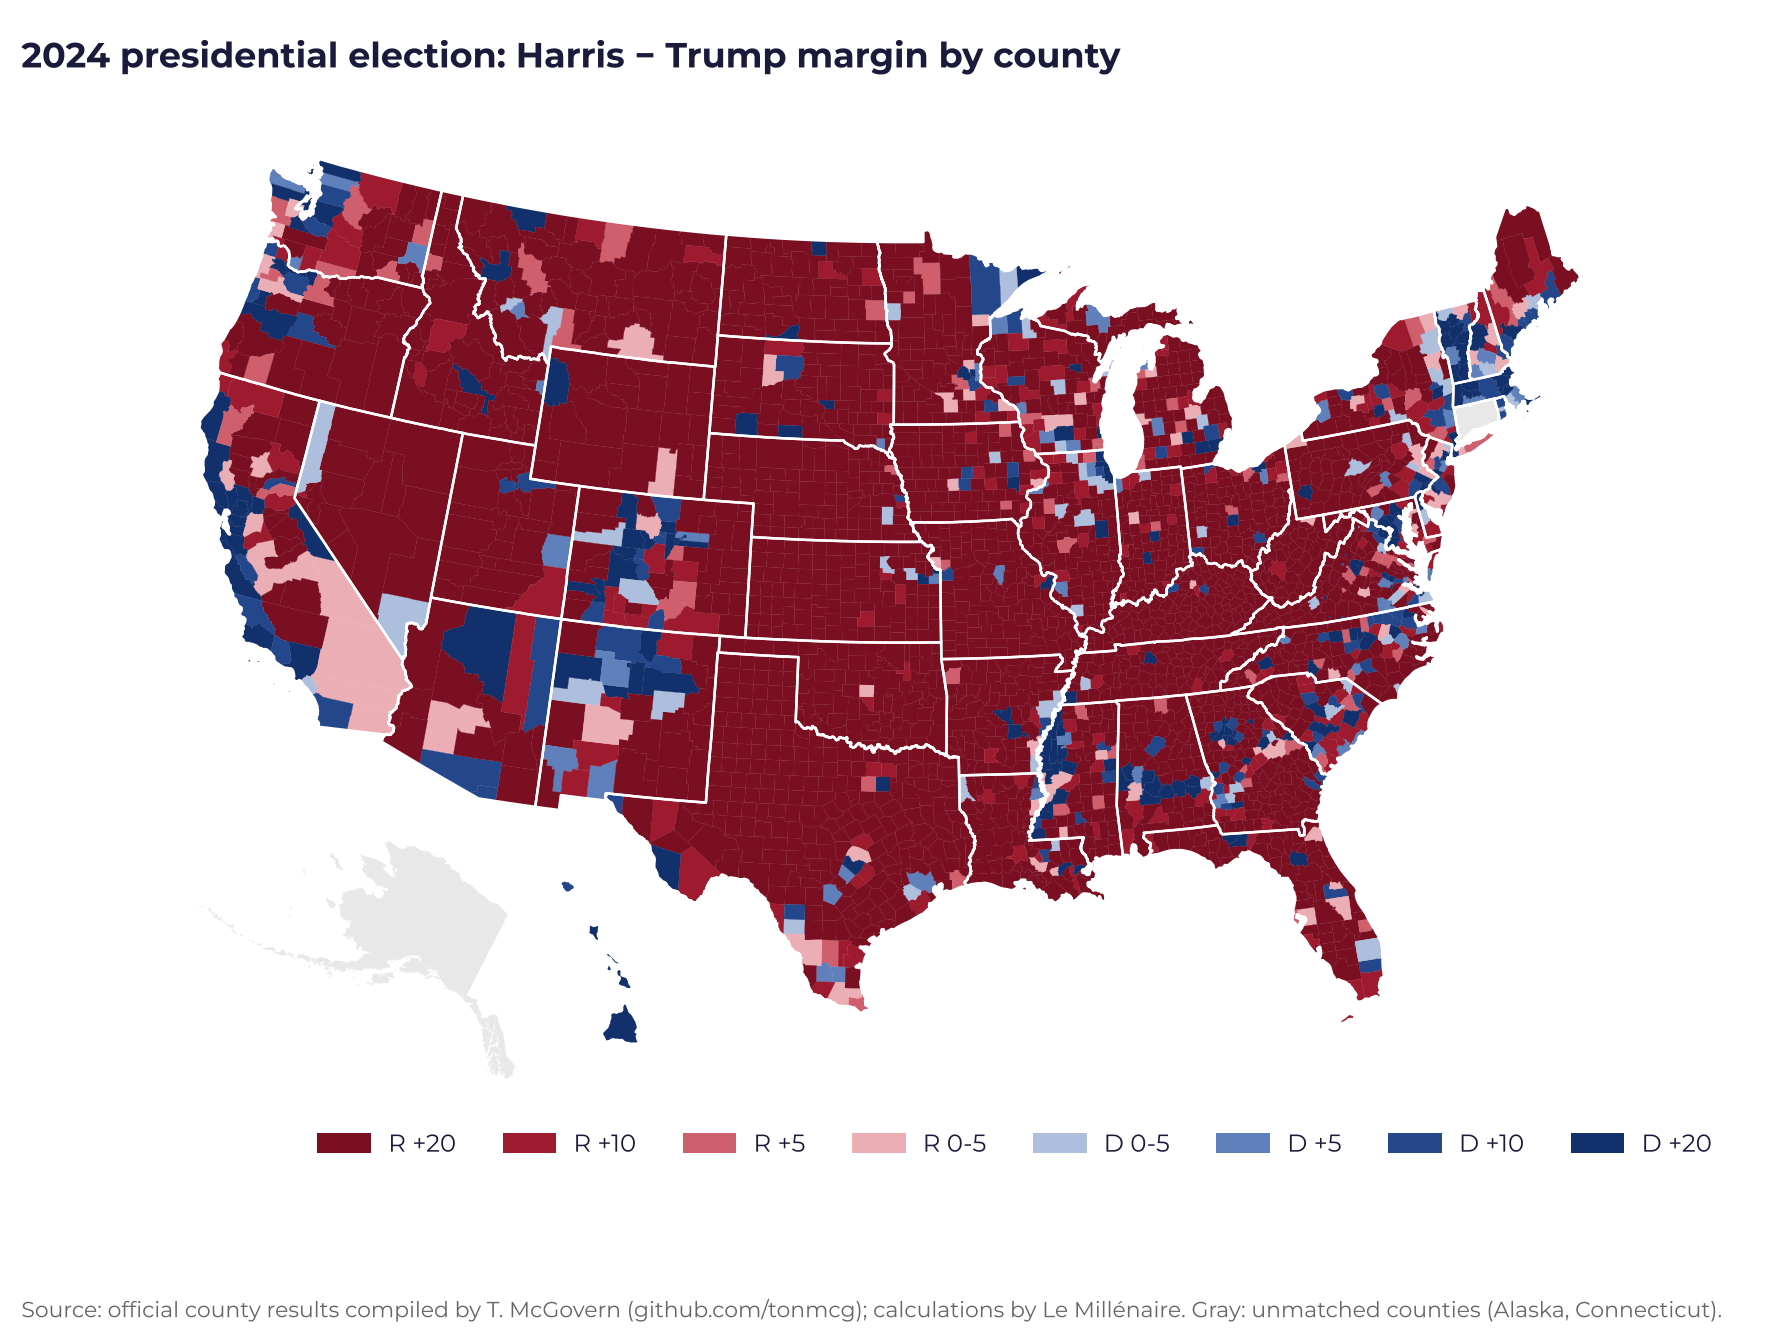
The shift was not uniform. The steepest Democratic declines were in large cities with large immigrant populations and in Hispanic counties: 22.5 points of margin lost in the Bronx, 18.9 in Miami-Dade County, 20 to 26 points in the Rio Grande Valley. Affluent, college-educated suburbs barely moved. There, a modest rebound is enough for Democrats to flip a district Donald Trump won by two points. In Miami or the Rio Grande Valley, everything depends on how long the shift lasts.
Two maps, two elections. In the House, the district that delivers the majority, the 218th when the 435 districts are ranked from most Democratic to most Republican, is Virginia’s 2nd district, won by Donald Trump by 0.3 point in 2024; in the Senate, the race that gives Democrats and their allies the 51st seat is Louisiana, won by Donald Trump by 22.0 points.
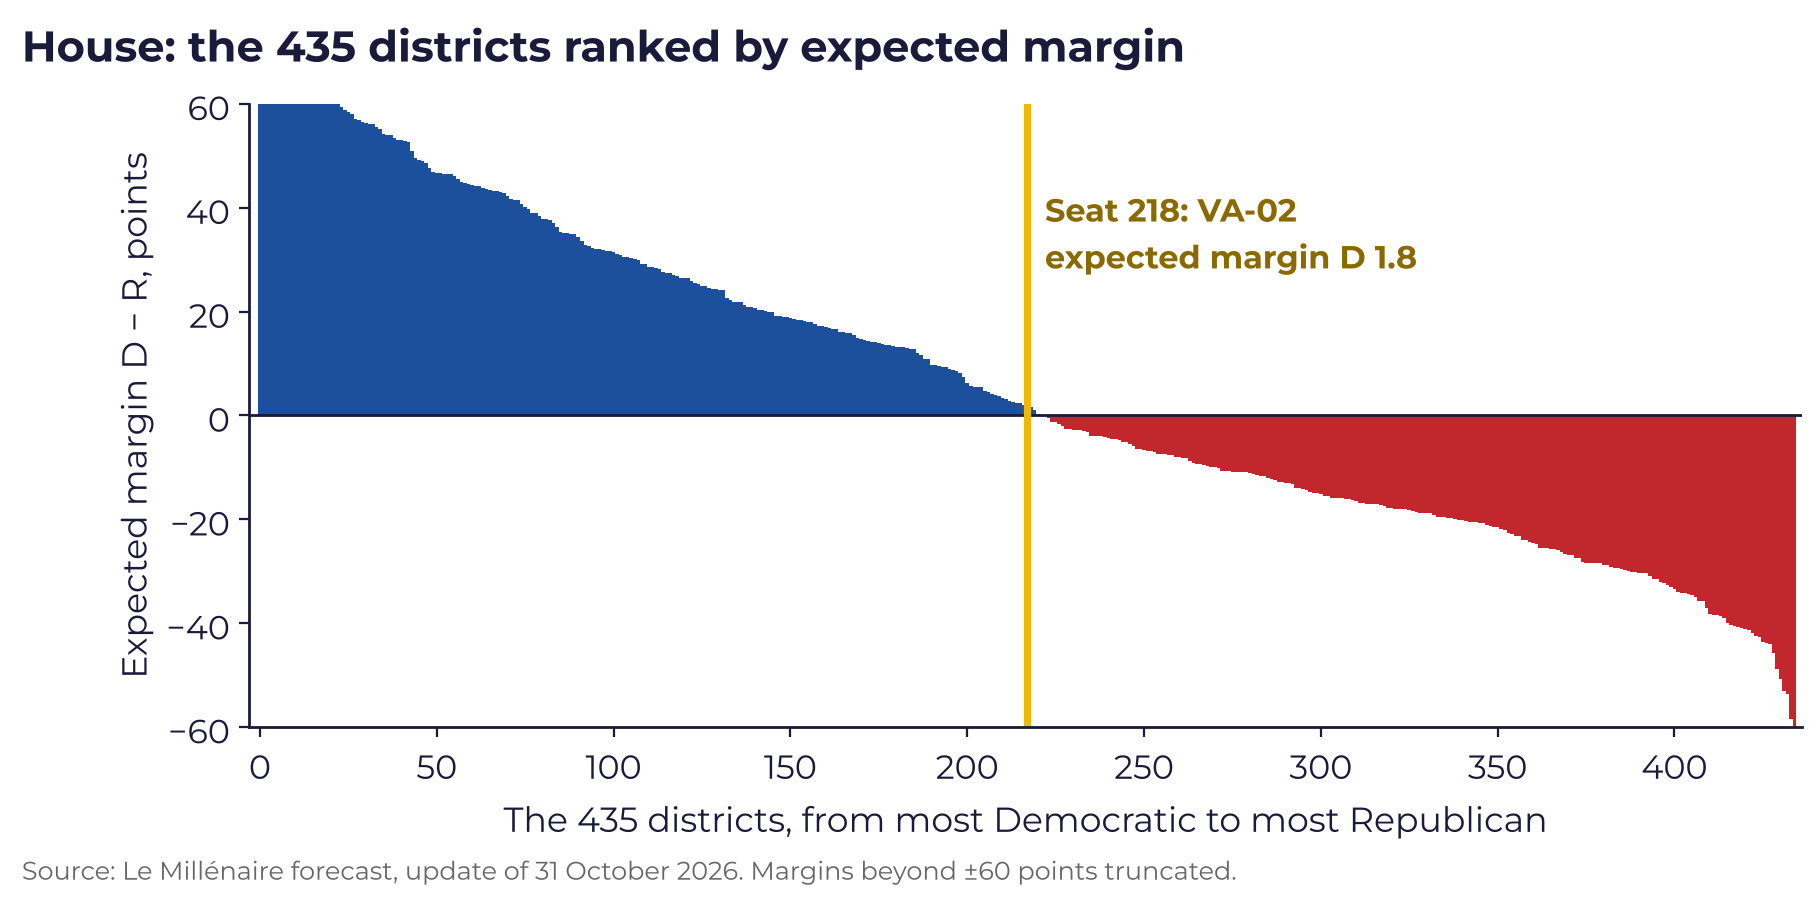
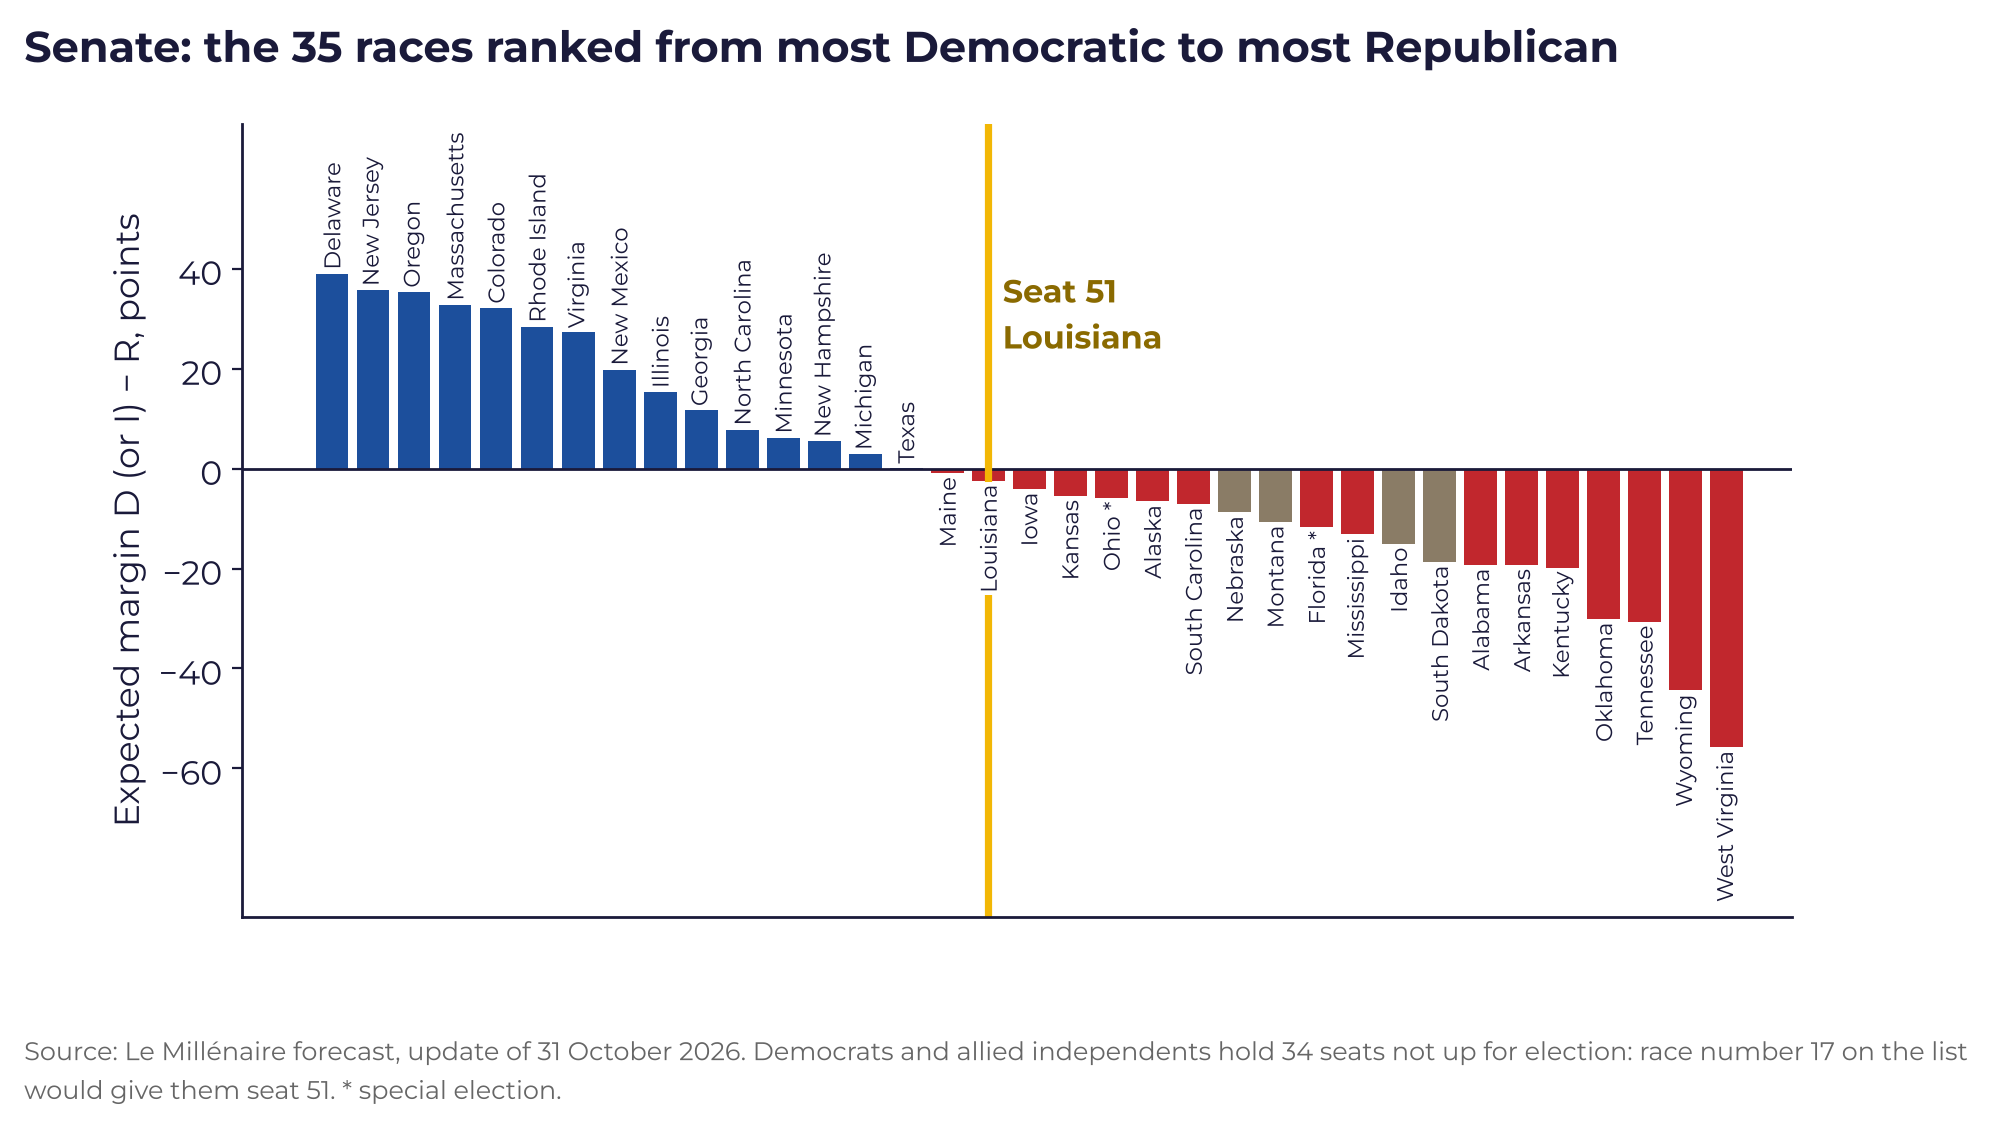
Thus a national climate of about 5 points of margin in Democrats’ favor, the one our model uses after correcting the polls, is enough to flip the House but not the Senate, where Democrats would need either a much more favorable climate or candidates able to run well ahead of their party in Republican states. That is precisely the bet they are making in Texas (James Talarico), Ohio (Sherrod Brown), Alaska (Mary Peltola) and, through independent Dan Osborn, Nebraska.
How our model reads the election
For each race, the model combines the state or district polls, averaged by giving more weight to the most accurate pollsters and to the most recent fieldwork, with the state’s history (its vote in previous elections and the incumbency advantage) and the fundamentals, that is, the 2024 presidential vote and the national climate. In the House, where district polls are rare, fundamentals dominate.
The model then subtracts from Democrats a correction learned from polling error in the 2006 to 2022 midterm elections, at the same distance from election day, amounting to 2.3 points of margin three days before the vote. It spares contests between an independent and a Republican. We regard it as the main methodological choice in our forecast, and it is mainly what makes us more cautious than prediction markets and several American models.
In sixteen of the twenty-one Senate races we follow closely, our projection leans toward the Republican Party by at least 2 points more than the polling average. In Texas, the polling correction is essentially enough to cut Talarico’s 4.0-point lead in the polls to 0.2 point in our projection.
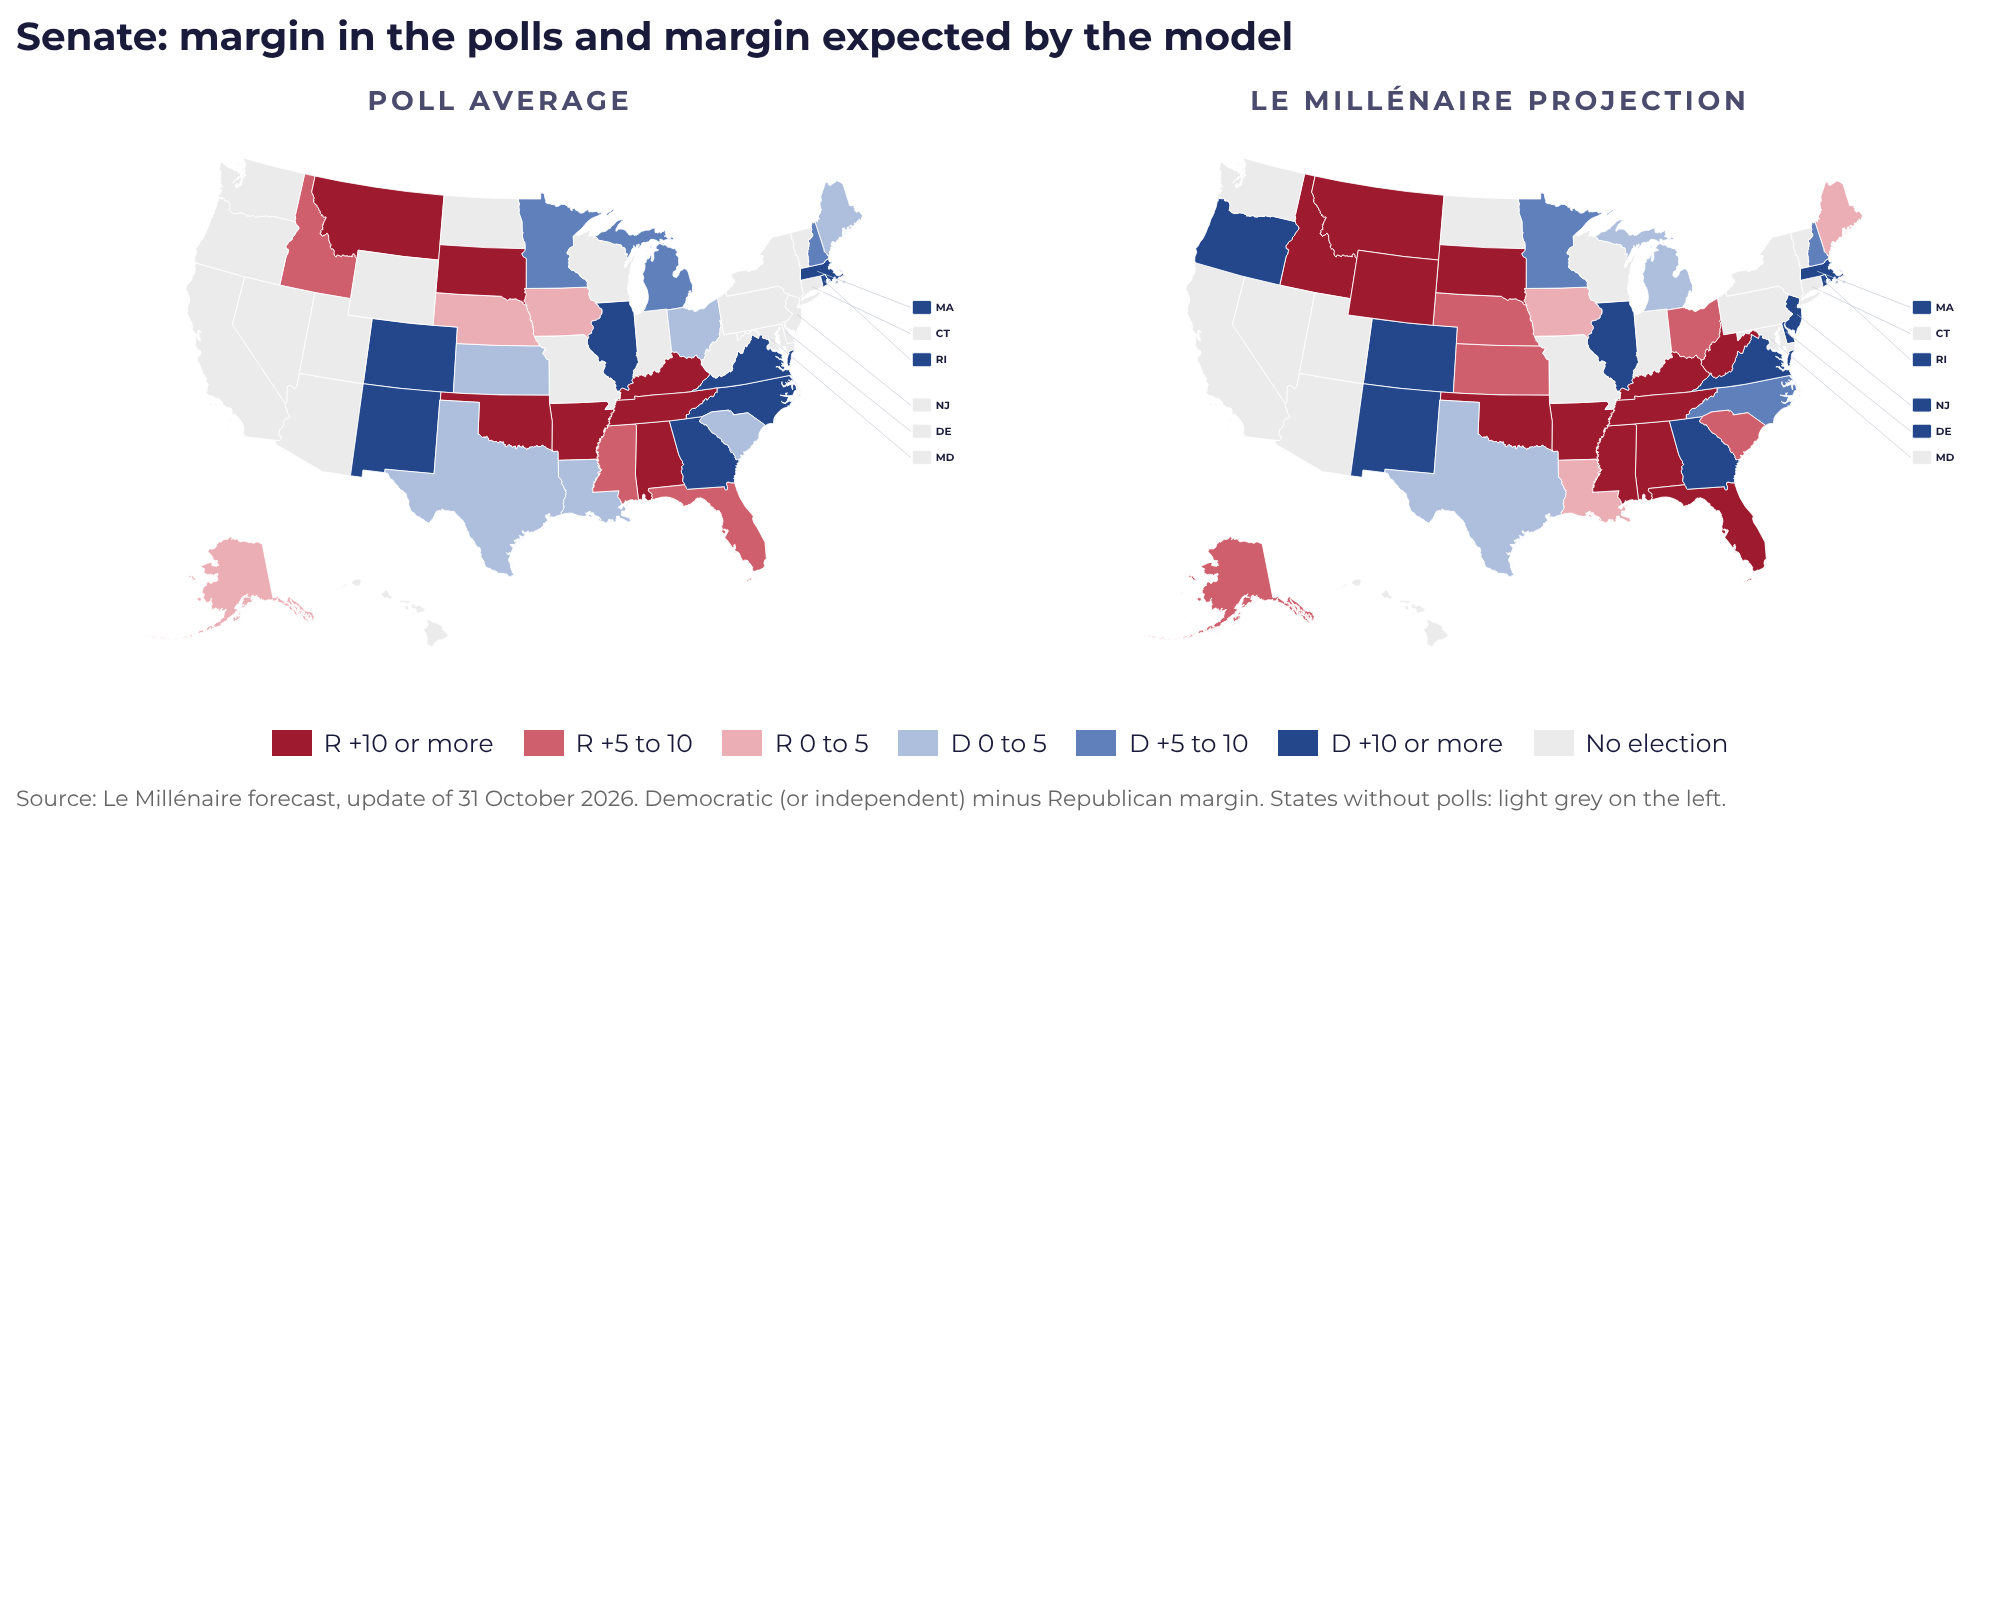
If we remove all corrections and award each race to the candidate leading in the polls, Democrats get 53 Senate seats, 242 House seats and 25 governors. The gap between this scenario and our forecast essentially measures what is really at stake: whether or not the polls once again underestimate Republicans.
Follow the forecast until November 3
The figures in this note come from Le Millénaire’s forecast: 200,000 simulations of the election, updated every day until the vote. There you will find each party’s chances, the projection for every race and the simulator, which lets you set the winner of one race and recalculate the rest of the map.
Why each race tips
For each decisive race, one factor weighs more heavily than the others in the projection. There are six.
The national climate decides the House. The model adds 7.2 points of margin in Democrats’ favor to each district, of which the polling-bias correction removes 2.3 points. With these two elements alone, the districts Donald Trump won by less than 5 points in 2024 move to the Democratic side. Few district polls have been published there: these districts tip together with the national vote.
The polling correction decides the Senate. Of the fifteen competitive Senate races, the polling average puts the Democrat or the independent ahead in eleven, and our projection in only six. In Ohio, Sherrod Brown leads in 17 of the 20 polls published since September, but the correction is compounded by Jon Husted’s incumbency advantage and by the history of a state that voted for Trump by 11.2 points: the model gives Husted a 78.6% chance. In Iowa, the average is almost even, and our projection gives Ashley Hinson a 4.0-point lead. This is the state where caution seems most justified to us, as the Selzer poll had Kamala Harris ahead by 3 points in 2024 when Donald Trump won by 13.2 points.
Incumbents who outrun their party. Susan Collins, in Maine, retains a 54.8% chance despite trailing Troy Jackson by 1.9 points in the polls, her incumbency advantage nearly canceling out the state’s Democratic lean. Phil Scott, Vermont’s Republican governor, retains an 81.1% chance in a state Harris won by 31.5 points. In Pennsylvania, Brian Fitzpatrick is the only Republican favored in a district won by Kamala Harris.
Unconventional candidates. The model lacks precedent. In Nebraska, Dan Osborn trails Pete Ricketts by 3.5 points in the polls and by 8.7 in the projection, a 23.6% chance, and he does not commit to caucusing with Democrats. In Ohio, Amy Acton leads in most polls for governor, and both Cook and Sabato rate the race “Lean D”, but the model gives Vivek Ramaswamy 72.2%.
Redistricting and the Hispanic vote. In Texas, Florida and Ohio, redistricting created Trump +9 to +12 districts, often Hispanic, which have become close. In Texas’s 15th district, which Trump had won by 18 points, a poll in which Bobby Pulido leads by 7 points raises Democratic chances to 60%. According to Telemundo, about two in three Hispanics disapprove of ICE’s conduct. The model, which carries over the 2024 vote, does not see this.
Where the model lacks information. Colorado has had no public poll since September: Phil Weiser’s 64% reflects the state’s fundamentals, nothing more. In New York’s 21st district, Blake Gendebien was favored only thanks to a single Siena poll; now that it has dropped out of the 21-day window, he has only a 26% chance.
Our analysis. The House follows the national climate. The Senate requires more: state polls that, this time, do not underestimate Republicans in Texas, Ohio or Maine, and a win by Dan Osborn or Mary Peltola. A Democratic House with a Republican Senate would be, in our reading, the map that speaks.
Three linked elections
Le Millénaire’s simulator sets the winner of a race and recalculates the rest of the map. It then becomes clear that polling errors often run in the same direction for the House, the Senate and the governors.
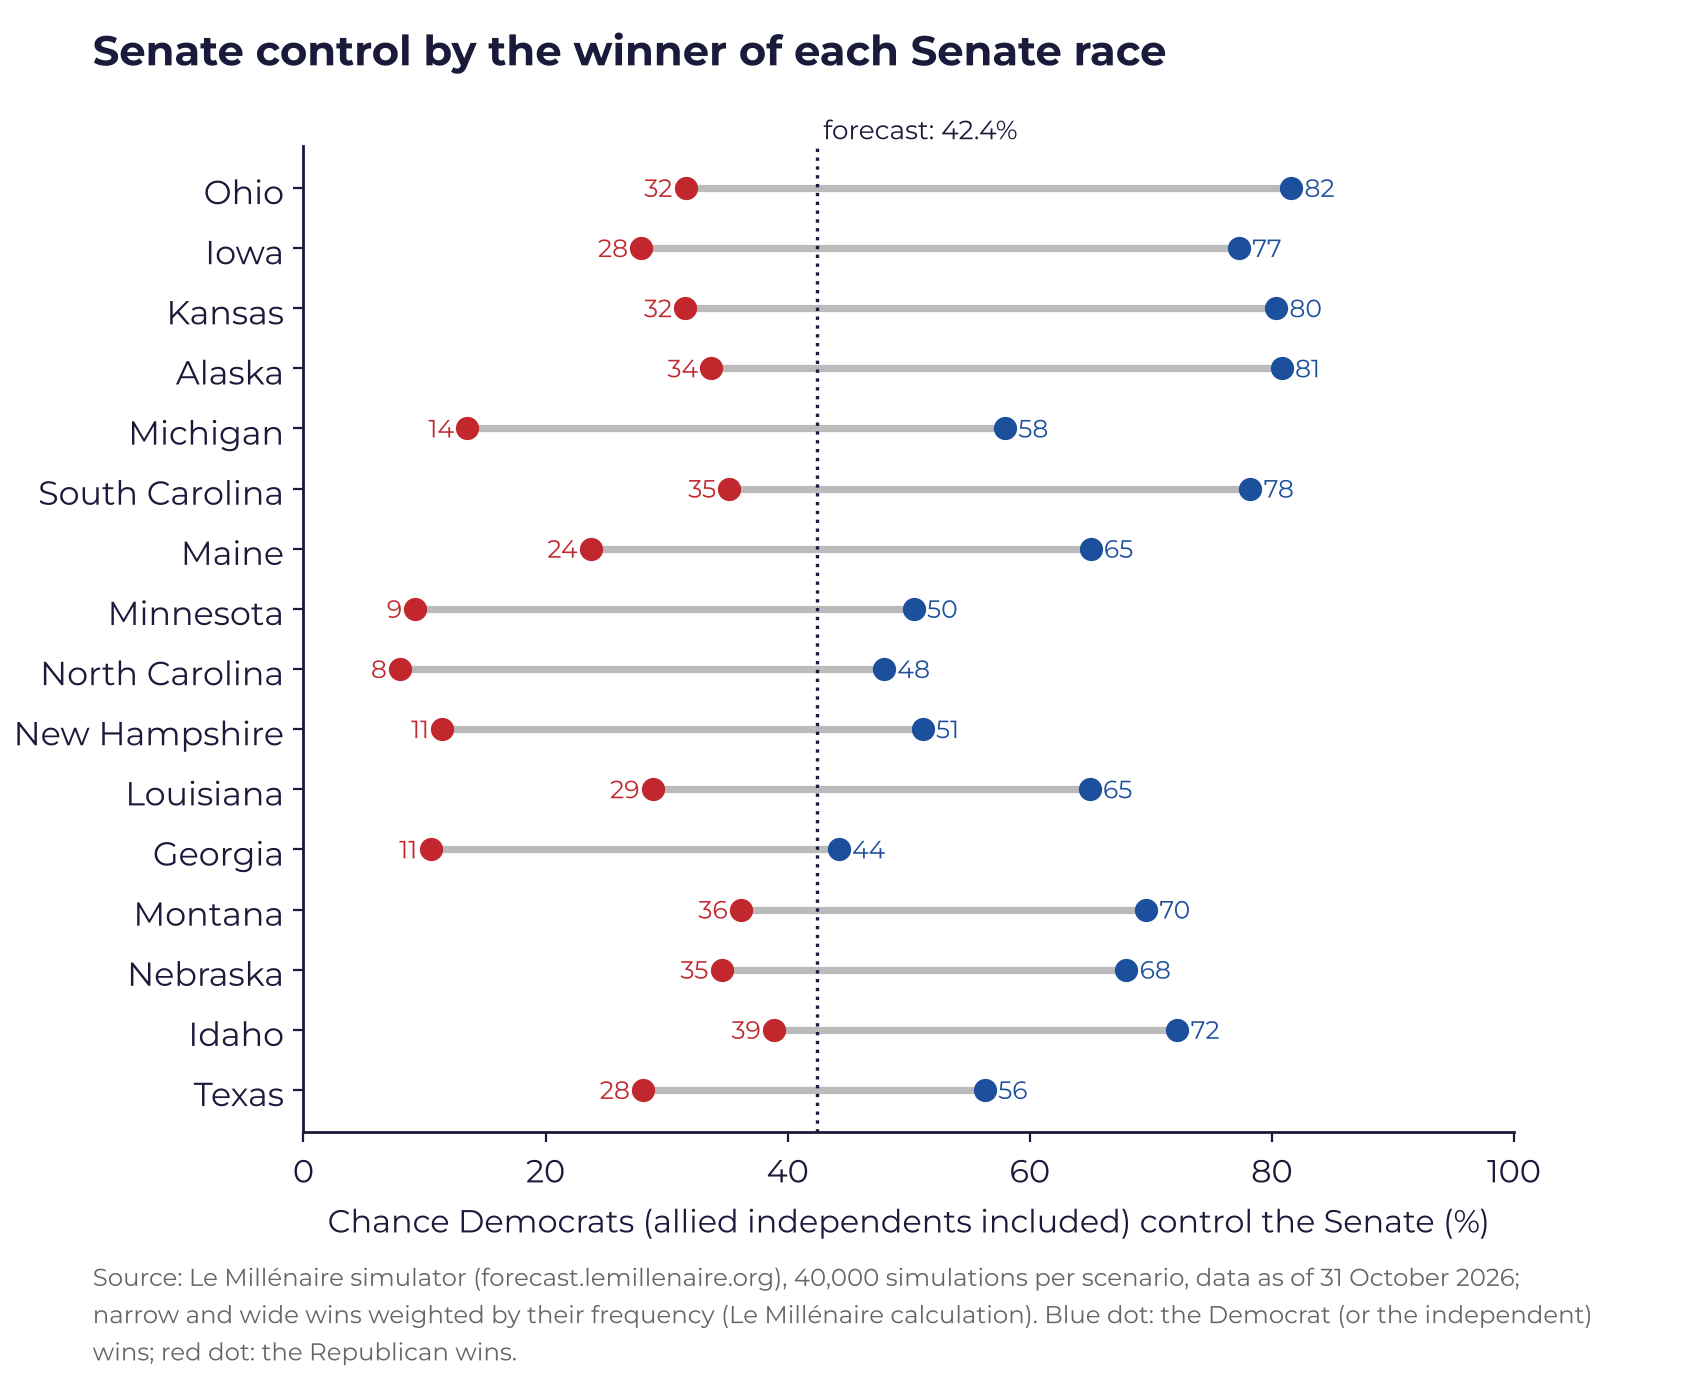
In Kansas, Ohio, Alaska or South Carolina, a Democratic win would push Democratic Senate chances above 70%, because such a win only happens in simulations where the national climate is very favorable to Democrats. Conversely, a loss in North Carolina, Georgia, Minnesota or New Hampshire leaves them with less than a 12% chance. Even a narrow win by Jon Ossoff in Georgia, where the model expects him to lead comfortably, would drop them to 26.2%.
The link with the House is just as clear: Democratic Senate chances go from 42.4% to 52.8% if Democrats win the House and fall to 8.5% if they lose it. In the other direction, a Republican win in North Carolina or Georgia would bring Democratic House chances down to between 45% and 48%. Overall, both chambers Democratic come out in 40.5% of simulations, a Democratic House and a Republican Senate in 36.2% and both chambers Republican in 21.3%.
What if the polls are wrong?
Our polling-errors tool applies to the 2026 polls the error observed in a past election, on top of our projection, which is already corrected for the usual polling bias.
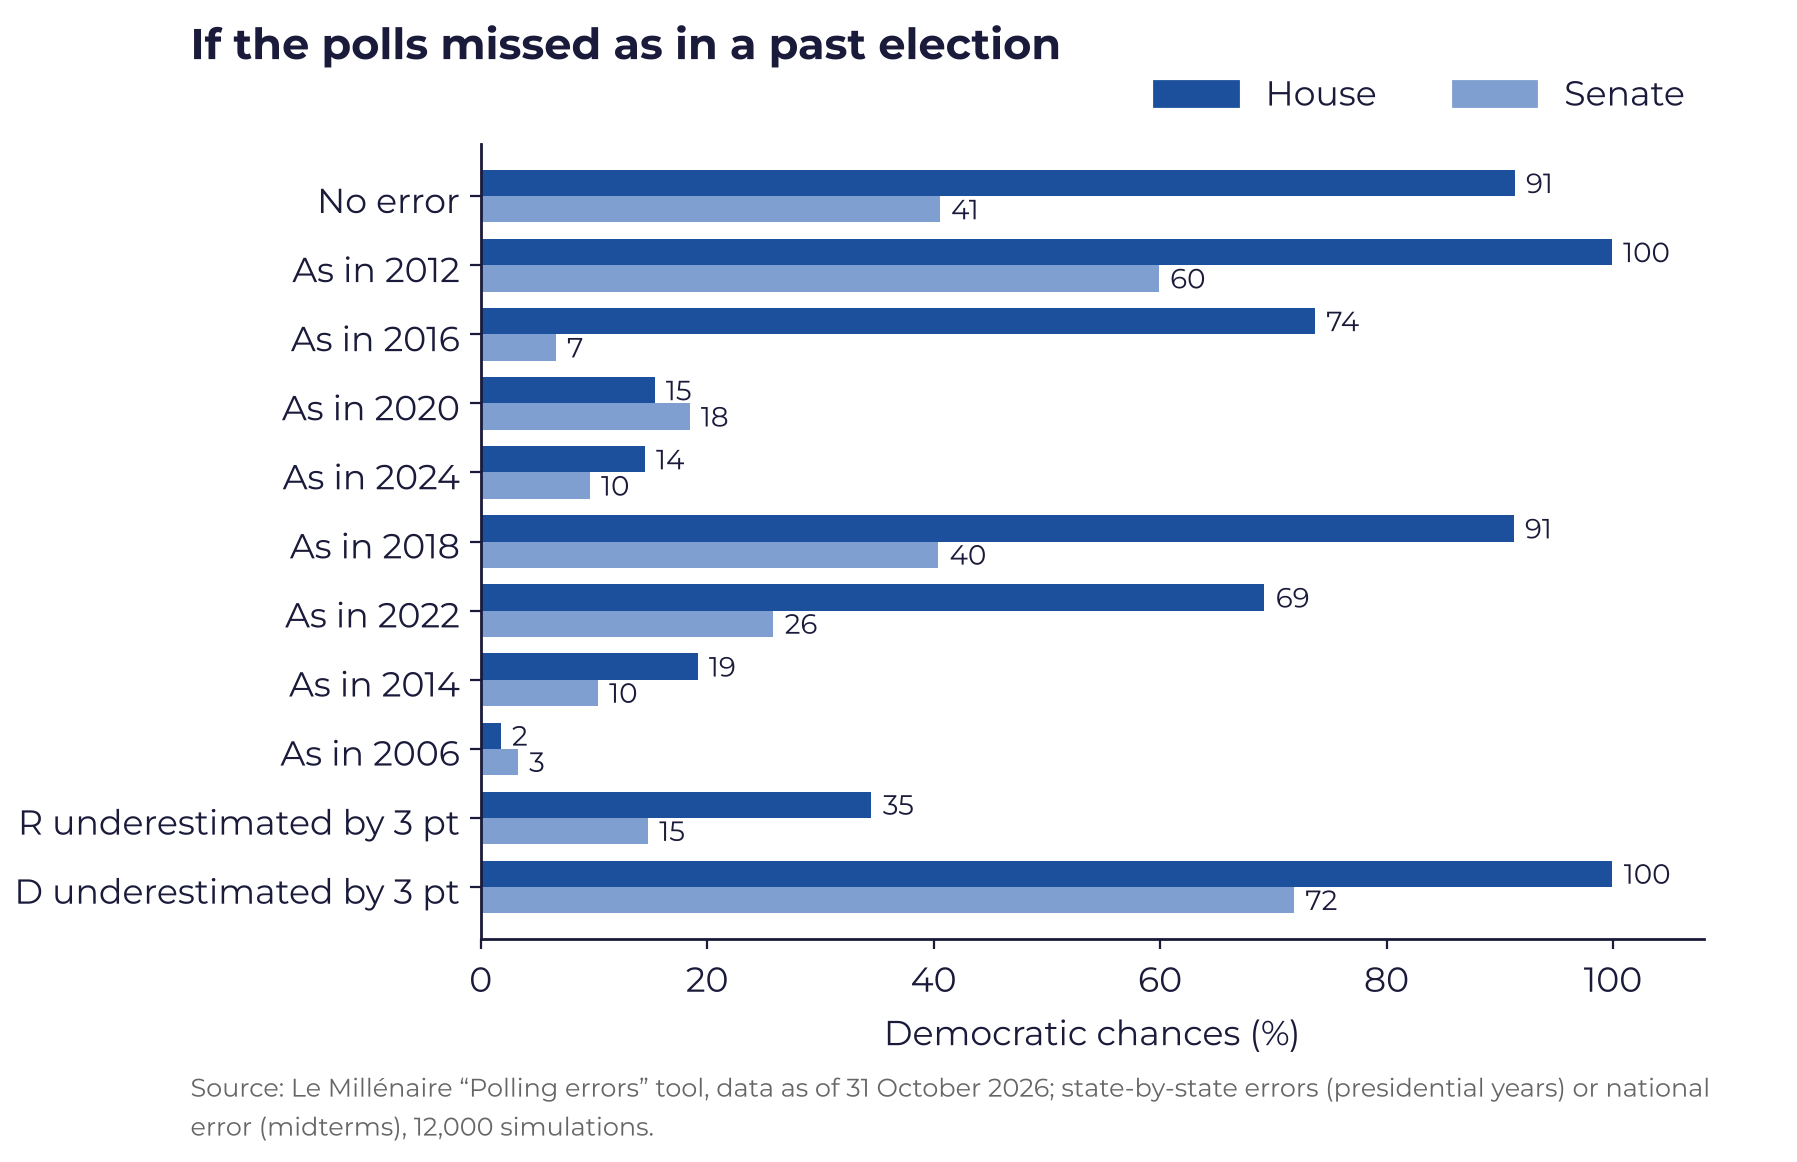
With no additional error, Democrats win the House in 91.3% of simulations and the Senate in 40.5%, whereas an error comparable to 2020 or 2024 would take the House away from them more than eight times out of ten; that of 2016, of similar size, would leave it to them in 74% of cases, because, in our reading, of its distribution, stronger in the Midwest and the South than on the coast. In the Senate, only the 2012 scenario exceeds even odds (59.9%).
The Senate is also much more sensitive to the vote of white voters without a college degree than to that of Hispanics: a three-point error on the former nearly cuts Democratic chances in half, while an error of the same size on the latter reduces them by only a sixth. Indeed, Iowa, Maine, New Hampshire and Ohio are among the states where this electorate weighs most. The House only becomes uncertain if the two errors combine, with Democratic chances then falling to 43.0%.
Early voting: first signals
More than 28 million Americans had already voted by October 26, according to the University of Florida’s Election Lab, and our tracking shows turnout well above 2022 in most states that allow a comparison. In states where voters register with a party, the party label of those who have voted sheds light on each side’s mobilization, even though a registration is not a vote.
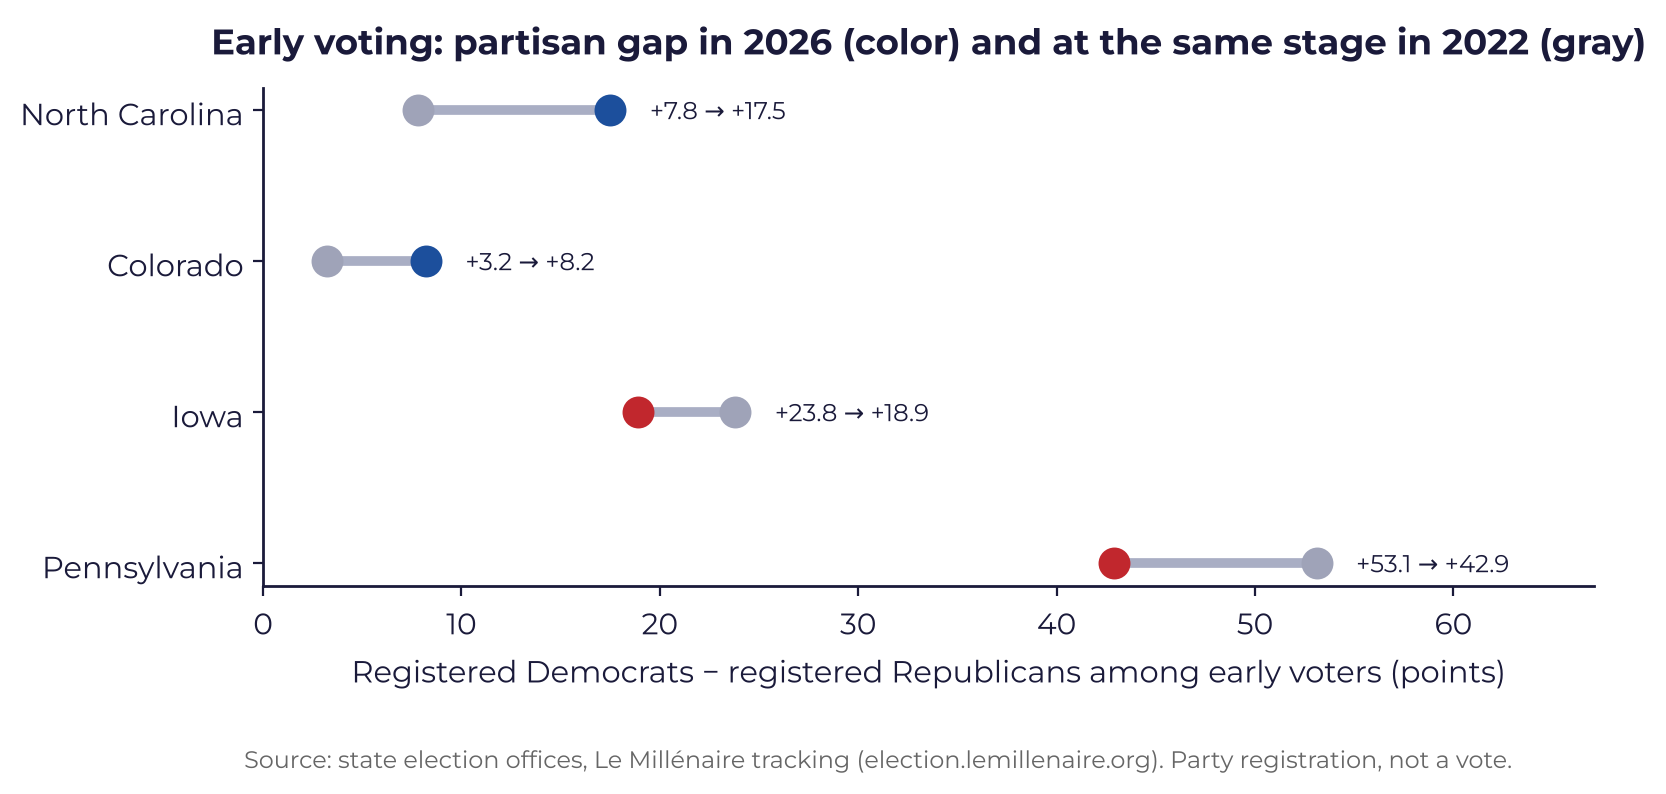
In North Carolina, registered Democrats lead Republicans by 17.5 points among early voters, compared with 7.8 points at the same stage in 2022, and in Colorado the gap grows from 3.2 to 8.2 points. In Pennsylvania, by contrast, it shrinks from 53.1 to 42.9 points, and in Iowa from 23.8 to 18.9 points, which signals better Republican mobilization than in 2022 in mail voting. These figures do not enter the model and will be used on election night to spot the first deviations from the forecast.
The night of November 3
Georgia and North Carolina. There we project Democratic Senate leads of 11.7 and 7.8 points. Gwinnett and Cobb counties, in suburban Atlanta, and Wake and Mecklenburg counties, around Raleigh and Charlotte, will be the first to watch. If Jon Ossoff or Roy Cooper wins by only 5 points or less, the simulator brings Democratic Senate chances down to between 26 and 30%, and House chances well below our forecast. Margins in line with the projection would, on the contrary, make Texas, Maine and Ohio winnable.
The Midwest and Pennsylvania. In Ohio and Iowa, we will see whether white working-class voters who backed Trump in 2024 have returned to Democrats. In Pennsylvania, the districts polled by the New York Times and Siena will test the generic ballot.
The border. The test will be the Hispanic vote. From the Rio Grande to Miami-Dade, we will find out whether the 2024 swing toward Trump has held, and seven districts depend on it (Texas 15, 28, 34 and 35, Florida 14, 22 and 25).
It is also possible that the Senate majority will not be known on election night. At 50-50, everything could hinge on Dan Osborn, Nebraska’s independent, who has not committed to either side. In Alaska, the final result can take up to two weeks.
The House is being fought in suburbs narrowly won by Trump in 2024, the Senate in states he carried by more than ten points.
Conclusion
Democratic House and Senate: this is, narrowly, the most likely scenario three days before the vote, ahead of a Democratic House with a Republican Senate. The House is being fought in suburbs narrowly won by Trump in 2024, the Senate in states he carried by more than ten points.
Polls and markets are more optimistic for Democrats. Some polls put them ahead in Texas, Ohio, Maine and Kansas, and prediction markets make them the favorites for the Senate. Our model, for its part, takes into account that the polls underestimated Republicans in the last five midterm elections. If this error recurs, even in a milder form, the Senate will very likely be Republican; if it does not, Democrats can win both chambers.
After November 3, attention will turn to Texas, Florida and the suburbs of Pennsylvania and Michigan. There we will see whether the 2024 realignments last: that of Hispanics and big cities toward Trump, and that of college-educated suburbs toward Democrats. And, two years out from 2028, whether Trump’s coalition belongs to the Republican Party or to him alone.
Le Millénaire’s four Midterms 2026 notes
Midterms 2026: The Keys to the Vote
The general note: what is at stake on November 3, how the forecast works and six tipping mechanisms.
You are reading this noteHouse of Representatives 2026: District by District
The 53 districts that decide the majority, from Pennsylvania’s 8th to the Rio Grande Valley.
Read the note →Senate 2026: Race by Race
The fifteen competitive races and the Democrats’ path to the 51st seat.
Read the note →Governors 2026: State by State
The 36 offices at stake, from Wisconsin to Ohio, and what they say about 2028.
Read the note →Thay W., Scull S., Bataille A., “Midterms 2026: The Keys to the Vote”, Le Millénaire Note, November 1, 2026, lemillenaire.org.
Browse the note
William Thay, Sean Scull and Augustin Bataille
President of Le Millénaire; United States specialist at Le Millénaire; Analyst at Le Millénaire.
William ThayRequest an interview
For an interview with William Thay, Sean Scull or Augustin Bataille about this note: presse@lemillenaire.org
Contact the press officeKeep our studies going
Your donations and memberships fund Le Millénaire’s next notes.
Support us JoinReceive Le Millénaire’s next briefing notes
Read also
All studies 21 octobre 2026Midterm 2026 : vers la fin du mouvement MAGA ?
 17 avril 2026Sean Scull pour Nouvelle Revue Politique : « Négocier ou escalader : ce que révèle la politique erratique de Trump en Iran »
 30 mars 2026Quand les démocrates se cherchent leur Trump
 5 février 2026Sean Scull pour Valeurs Actuelles : « Mais que va faire Donald Trump jusqu’à la fin de son mandat ? »
