

This page is a translation of the original French text. It may contain errors; the French version is the reference text: Sénat 2026 : course par course
Le Millénaire in-depth note on the Senate elections of November 3, 2026
On the poll average alone, Democrats and their allied independents would hold 53 Senate seats on November 3. The Le Millénaire forecast, drawn from 200,000 simulations, gives them 50.1, with a 42.4% chance of control. William Thay, Sean Scull and Augustin Bataille review the fifteen competitive races, from Texas to Georgia, up to the 51st seat.

A Senate that leans right
Democrats and their allies have a 42.4% chance of controlling the Senate, with 50.1 seats expected. The most frequent outcome is 50 seats, followed by 49: a Senate split down the middle that stays Republican, with J.D. Vance breaking ties.
Why the model corrects
The model subtracts 2.33 points from the Democratic lead in every head-to-head against a Republican, the average overestimation by the polls in the 2006 to 2022 midterm elections. It also gives weight to each state’s history and to the incumbency advantage.
The Democrats’ path
The Democrats must hold Georgia, North Carolina, New Hampshire, Minnesota and Michigan, then win three races among Texas, where the Democrat is just barely ahead, and those where the Republican is ahead: in Maine, Louisiana, Iowa, Kansas, Ohio or Alaska.
Foreword
The outgoing Senate has 53 Republicans and 47 members of the Democratic caucus, independents included. Of the 35 seats up, including two special elections in Florida and Ohio, Republicans are defending 22 and Democrats 13. Democrats need a net gain of 4 seats: at 50-50, Republican Vice President J.D. Vance breaks ties.
The 2026 map is unfavorable to Democrats. The 13 Democratic seats up include 4 contested states, Georgia, Michigan, Minnesota and New Hampshire, whereas most of the 22 Republican seats are in states Donald Trump won by more than 10 points in 2024: Iowa, Ohio, Alaska, Texas, Kansas, Nebraska and South Carolina. Maine is the only Republican seat up in a state won by Kamala Harris.
The figures come from the October 31, 2026 update of the Le Millénaire forecast. The note reviews the races already settled, then the fifteen competitive ones, each following the same outline: geography, candidates, polls, analysis. It ends with the combinations that lead to the 51st seat and the benchmarks for the night of November 3.
Why the Senate leans Republican
In eleven of the fifteen competitive races, our poll average puts the Democratic or independent candidate ahead, whereas our forecast keeps only six: Maine, Ohio, Kansas, South Carolina and Louisiana move from a narrow Democratic lead in the polls to a Republican lead in the forecast.
Minus 2.33 points: that is what the model subtracts from the Democratic lead in every head-to-head against a Republican. It is the average overestimation by the polls in past Senate elections, at the same distance from Election Day. In Nebraska, Montana, Idaho and South Dakota, where an independent faces a Republican, there is no track record, and therefore no correction. The center of the forecast rests first on the polls, then on the state’s electoral history, incumbency advantage included, and, to a lesser extent, on structure.
Across 148 Senate elections, from 2014 to 2022 and 17 days before the vote, the historical block lowered the average error from 4.92 to 4.46 points, and correctly called winners rose from 87.8% to 89.2%. But if the 2026 polls are right, it is the model that underestimates the Democrats.
The map: 34 seats in hand, 17 races to line up
Twenty of the 35 races leave little doubt, nine for the Democrats and eleven for the Republicans. With their 34 seats not up, Democrats and their allies thus start from 43 near-certain seats, and Republicans from 42.

The figure reads from left to right. The first nine races are in hand for the Democrats, followed by five races where the Democrat is favored (Georgia, North Carolina, Minnesota, New Hampshire, Michigan), for a total of 48 seats. The waterline falls just after: Texas (Talarico ahead by 0.2 point) and Maine (Collins ahead by 0.9 point) provide the 49th and 50th seats, and Louisiana (Letlow ahead by 2.4 points) the 51st. Between Michigan, the 14th race, and Louisiana, the 17th, the projected margin goes from a 2.9-point Democratic lead to a 2.4-point deficit.
Iowa, Kansas, Ohio, Alaska, South Carolina and Nebraska could also supply a 51st seat in place of Louisiana. In the simulations, a moderate polling error shared by these states flips two or three of them at once, hence a 42.4% Democratic chance for a central forecast of 50.1 seats.
Follow the forecast until November 3
The figures in this note come from Le Millénaire’s forecast: 200,000 simulations of the election, updated every day until the vote. There you will find each party’s chances, the projection for every race and the simulator, which lets you set the winner of one race and recalculate the rest of the map.
Texas: James Talarico vs. Ken Paxton
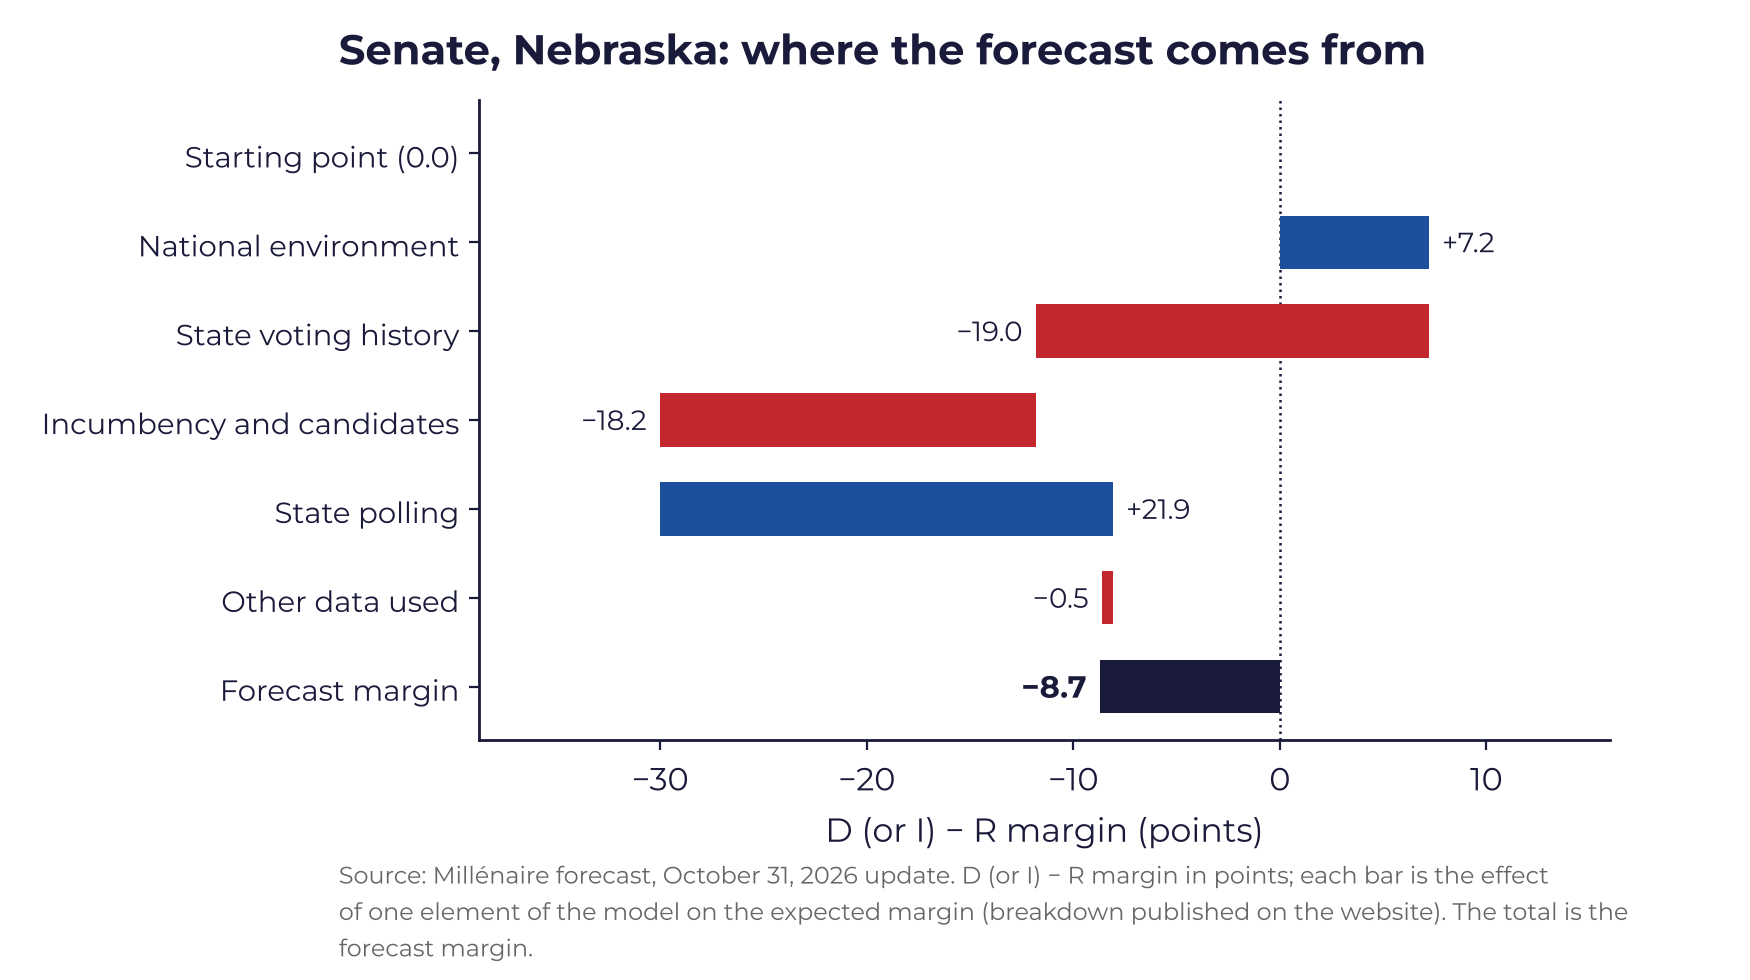
James Talarico leads Ken Paxton by 4.0 points in the polls. The forecast first removes their error, minus 2.3 points, then Texas’s Republican history, minus 12.2, which the national environment only partly offsets, plus 7.2. Result: Talarico has a 50.9% chance.
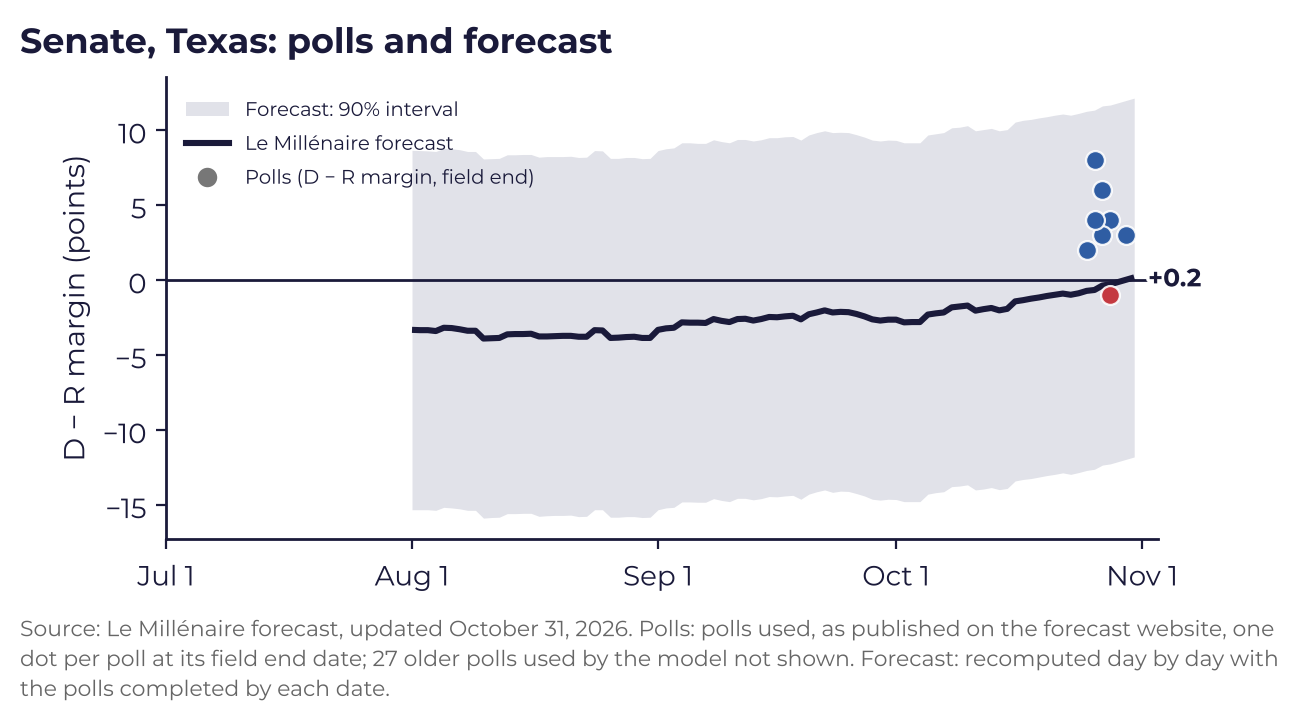
The 2024 shift was among the strongest in the country, and it hit hardest along the Rio Grande: Starr County, 97.7% Hispanic, voted Republican for the first time since 1892. Ken Paxton, the state’s attorney general, ousted Senator John Cornyn in the Republican primary runoff, after receiving Donald Trump’s endorsement. Campaign money is going decisively to Talarico, who set a Democratic record in the third quarter; Paxton is counting on outside money, “nearly all of it bankrolled by Elon Musk” according to the Texas Tribune.
Our analysis. Texas is the race where the model takes the most risk. Talarico must win back Hispanic votes in Hidalgo, Cameron, Webb and Starr, and push Paxton back in Collin, Denton and Williamson, where Cornyn’s electorate carries the most weight. Otherwise, strong rural and evangelical turnout on Election Day would be enough for Paxton.
Maine: Troy Jackson vs. Susan Collins
Troy Jackson leads by 1.9 points in the poll average. The model nonetheless puts Susan Collins ahead: a 54.8% chance, a 0.9-point projected lead. In the model, the incumbency advantage (minus 16.5 points) almost exactly cancels out what the state’s history and the national environment give Jackson (plus 8.4 and plus 7.2); the correction for polling error tips the rest toward Collins.
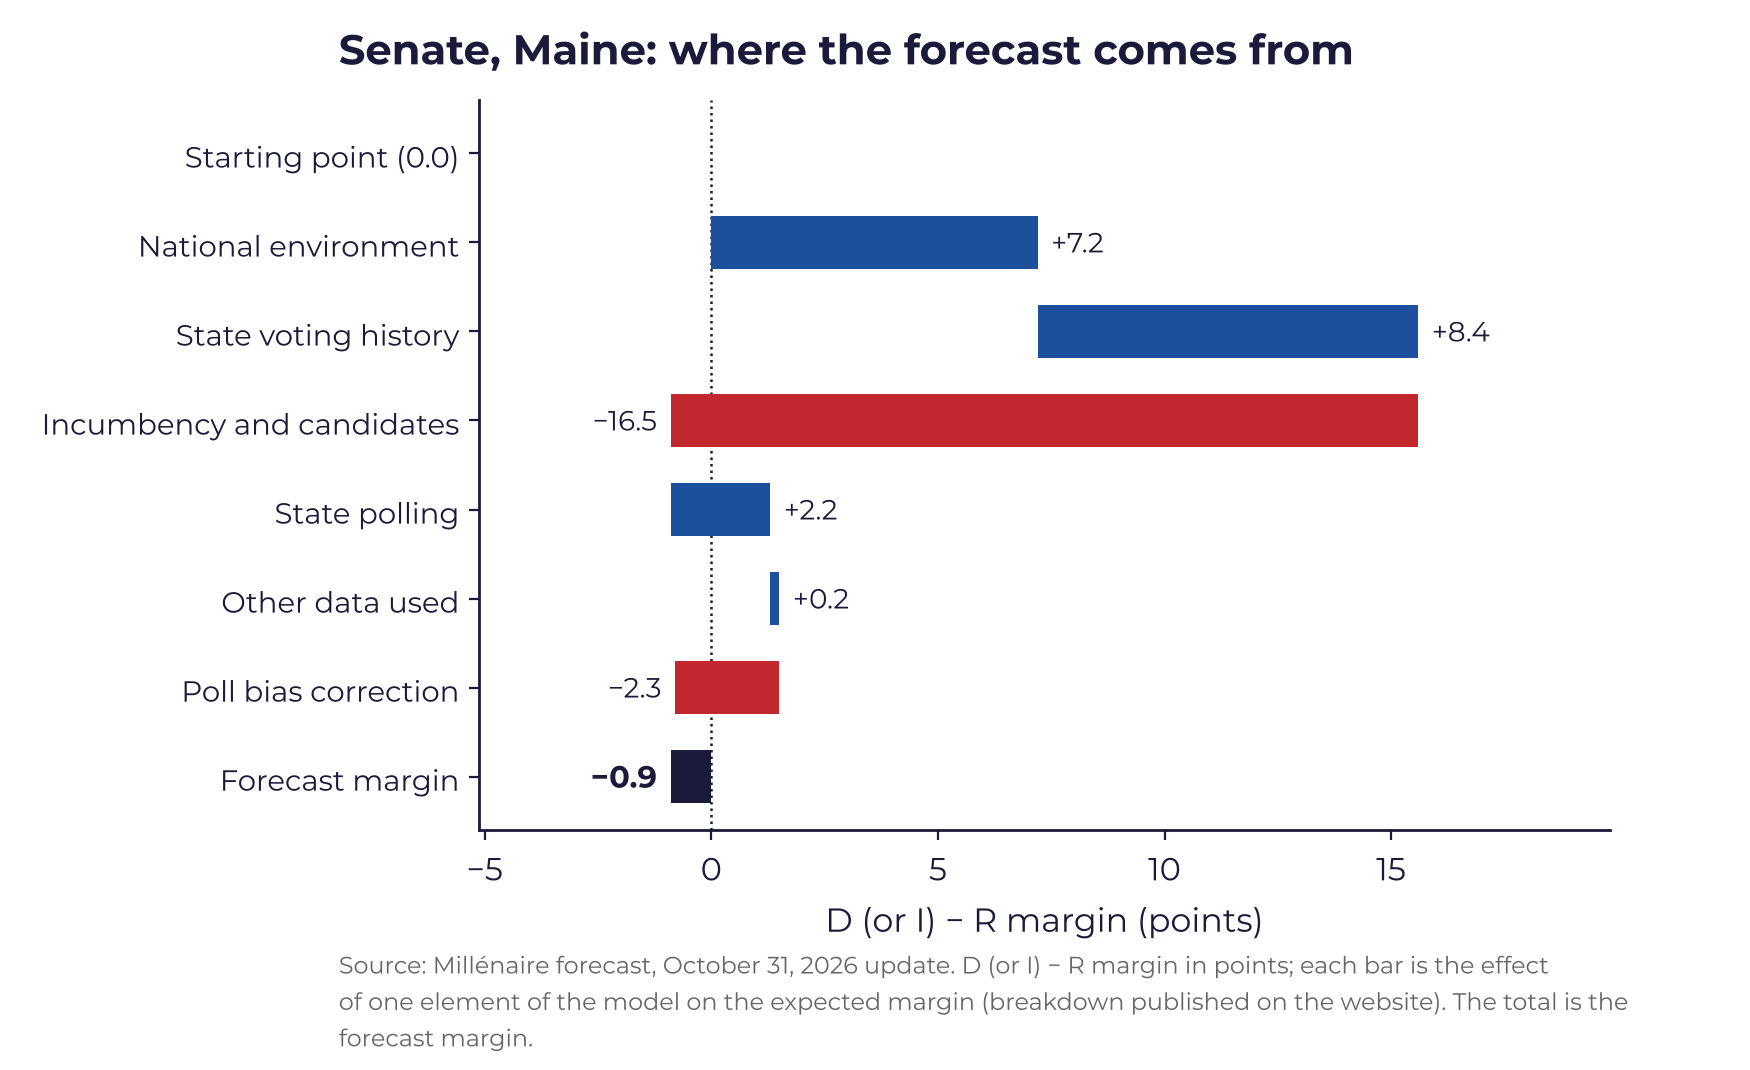
Democrat Graham Platner had won the primary, then withdrew after the revelation of a sexual assault allegation that he denies. A former president of the state Senate, Troy Jackson supports Medicare for All and abolishing ICE; Collins calls him a “Bernie Bro.” She is seeking a sixth term. She has not led a poll since September, which recalls 2020: the polls showed her losing, and she had won by nearly 9 points.
Our analysis. On election night, watch Kennebec and Androscoggin, won by Trump by 2.7 and 6.1 points. If Jackson leads there, Collins will have lost her personal advantage.
Michigan: Abdul El-Sayed vs. Mike Rogers
It is the only Democratic seat genuinely at risk. Mike Rogers nearly won in 2024, and the model gives Abdul El-Sayed a 65.4% chance. The Democratic defeat in 2024 played out first in Wayne County, where Dearborn, a city with a large Arab American population, put Trump ahead. The first Muslim candidate at this level in the state, El-Sayed could bring part of that vote back in Detroit; Republicans are targeting his progressive profile in Macomb and Oakland.

For the Democratic Party’s left wing, an El-Sayed victory in a swing state would legitimize the democratic socialists’ line for 2028. In the simulator, a Rogers win would drop Democratic Senate chances to 13.5%.
Our analysis. The trend will come from two suburban counties: Macomb (Trump plus 13.7 in 2024) and Oakland (Harris plus 10.6). If El-Sayed narrows the gap in the first and tops 10 points in the second, he wins.
That is how far the most famous poll in Iowa missed in 2024. Iowa comes right after the tipping-point race, Louisiana, and our model puts Ashley Hinson well above the polls there.
Iowa: Josh Turek vs. Ashley Hinson
Iowa comes right after the tipping-point race, Louisiana, which gives the Democrats their 51st seat. It is also the state whose most famous poll missed by 16 points in 2024, with the Selzer survey putting Harris ahead by 3 points. The average is close to zero, but four of the last five surveys put Hinson ahead.
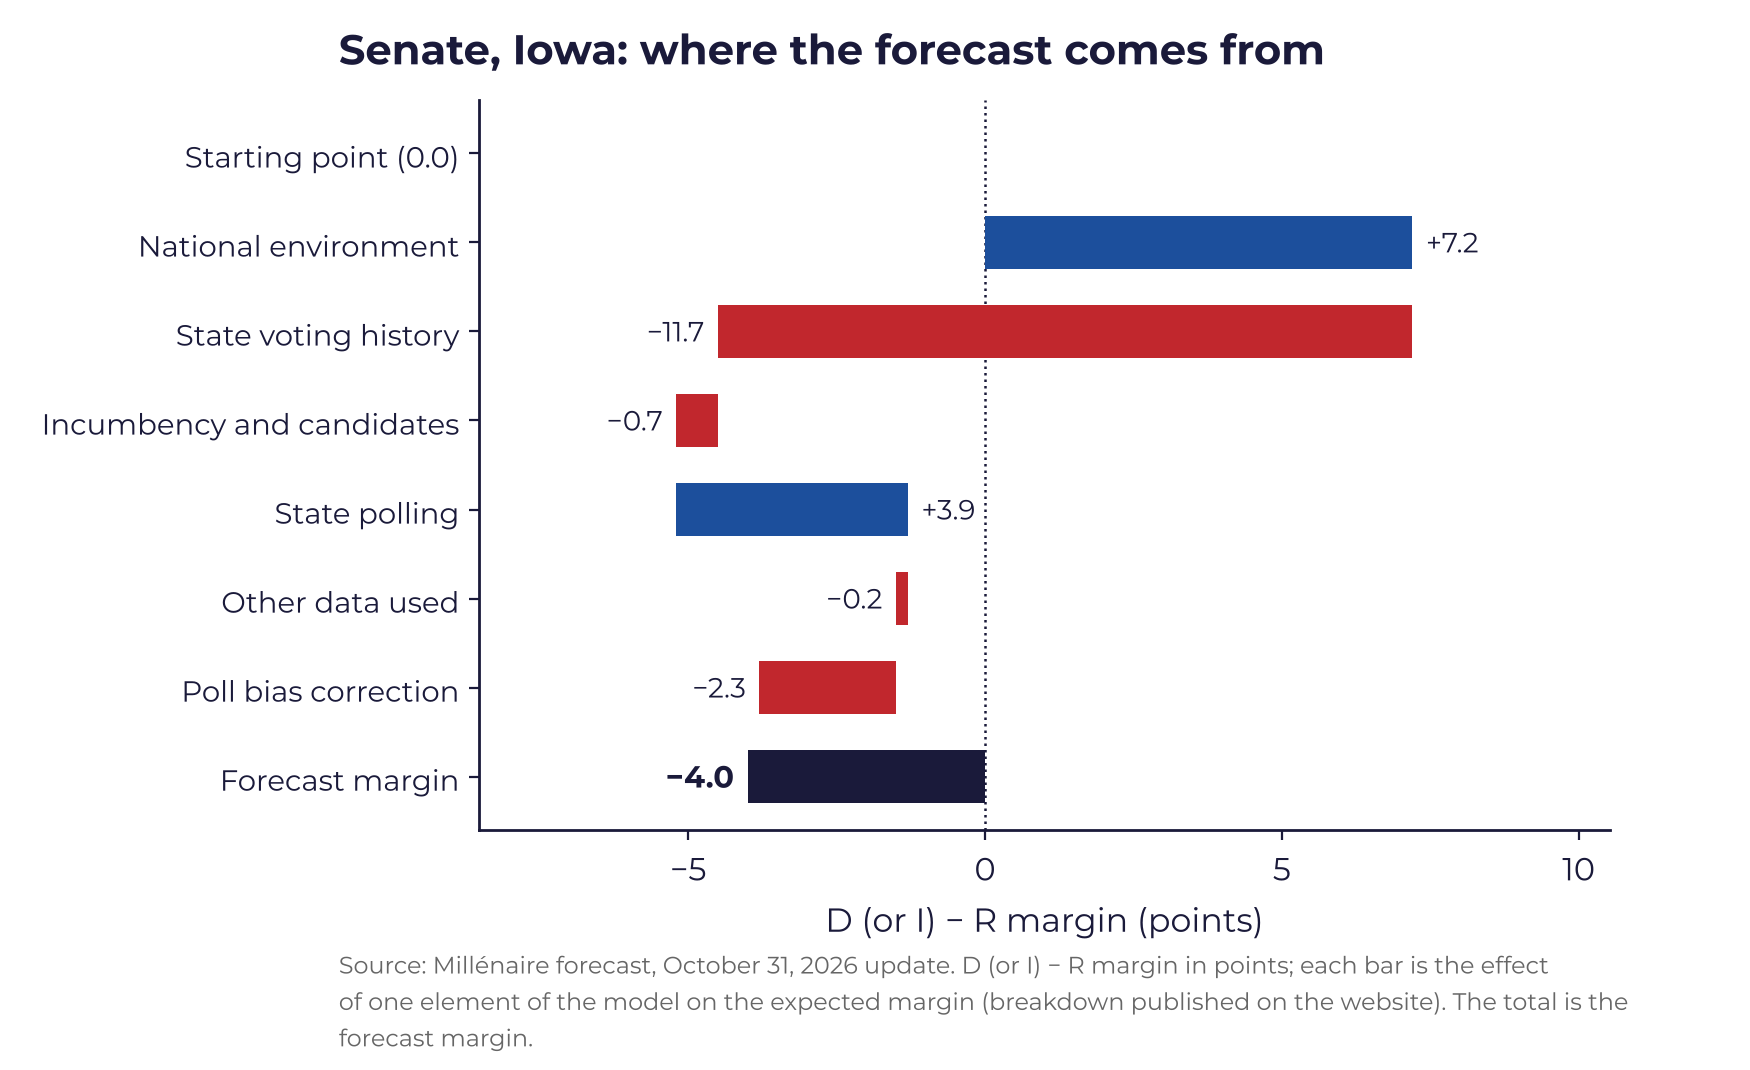
The polls add 3.9 points for Turek in the decomposition, and the national environment 7.2. Everything else works against him: above all the voting history of a state Trump won by 13 points (minus 11.7), then the poll error correction (minus 2.3). The link with the governor’s race is strong: if Rob Sand wins only narrowly, Turek’s chances fall, and if Zach Lahn wins narrowly, they collapse.
Our analysis. Without a clear Rob Sand win in the governor’s race, Turek will not win Iowa. The county to watch will be Scott, which Trump won by 3.9 points in 2024: without Scott, Turek will not win the state.
Ohio: Sherrod Brown vs. Jon Husted
Jon Husted has a 78.6% chance in the model. Yet it is Sherrod Brown who leads by 0.7 points in the polls: one of the largest gaps on the map, along with South Carolina and Kansas. Mike DeWine appointed Husted to replace J.D. Vance; Brown served in the Senate until 2025 and is campaigning on data centers and energy prices.
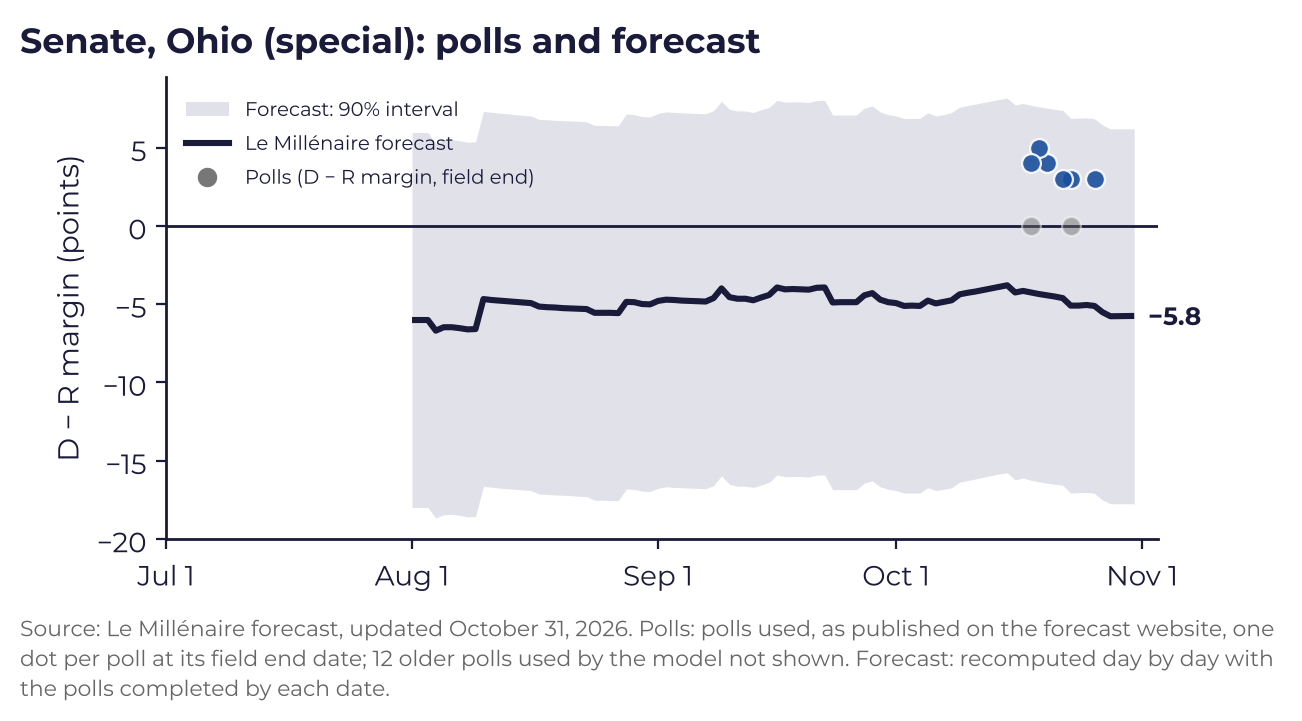
The model reverses the picture, mainly through the state’s voting history and the incumbency bonus granted to Husted. Yet Husted has never been elected to the Senate, and according to the Bowling Green poll, 25% of likely voters even wrongly believe that Brown is the incumbent. In the simulator, a Brown win, even a narrow one, would carry Michigan, Maine, Texas and Iowa along with it.
Our analysis. With Ohio’s polls, the Democrats would have a better than three-in-four chance of taking the Senate; the projection sees Husted winning by about six points. The bellwether county will be Montgomery (Dayton), won by Harris by 0.5 points in 2024: a Brown leading by more than 5 points in Dayton would win Ohio.
Nebraska and Alaska: unconventional candidacies
Nebraska. Democrats have chosen not to field a candidate and are backing independent Dan Osborn, a union leader, against incumbent Pete Ricketts. The polls put Ricketts slightly ahead, the model clearly ahead: a 23.6% chance for Osborn. Lacking a track record for such a contest, the model applies neither a polling error correction nor a structural block; the gap with the polls stems mainly from the state’s Republican history and the incumbency advantage. Osborn would need more than 60% in Douglas and a win in Sarpy, the bellwether county on election night.
Alaska. Mary Peltola leads in 8 of the 12 polls, but the model makes incumbent Dan Sullivan the favorite: an 81.5% chance and a projected lead of 6.5 points. In the final round of the ranked-choice count, our average assigns him the votes of a Republican namesake on the ballot, who has become the story of the campaign. The evening of November 3 will settle nothing: the final result may not be known until about two weeks after the vote.
The other decisive races
North Carolina. Former Governor Roy Cooper leads in every poll against Michael Whatley, and the Senate Leadership Fund has pulled its ads: it is the best Democratic pickup opportunity on the map (85.9%). A Cooper defeat would be the worst scenario for the Democrats.
Minnesota and New Hampshire. Peggy Flanagan (80.4%) has not trailed in any poll since September; Chris Pappas (77.6%) leads in every poll but one against John E. Sununu. In the simulator, losing either of these seats would all but close off the Senate to the Democrats.
Georgia. Jon Ossoff has a 94.6% chance and a projected 11.7-point lead. A narrow win would nonetheless lower Democratic Senate chances, to 26.2%: for a candidate expected to lead by 12 points, the simulator would read it as a nationwide overestimation of Democrats.
South Carolina and Kansas. Annie Andrews leads in our average against Darline Graham, appointed senator in July after the death of her brother Lindsey Graham; the model nonetheless makes Graham the favorite, as the state’s history and an incumbency bonus weigh heavily. In Kansas, which has not elected a Democratic senator since 1932, the surveys show Adam Hamilton slightly ahead of Roger Marshall, but the model makes Marshall a clear favorite. Kansas, along with Ohio and Alaska, is where a Democratic win would raise the chances of a majority the most: up to 80.3% in Kansas.
The path to a majority
Our simulator sets the winner of a race, then recalculates the chances everywhere else, including the model’s correlations.
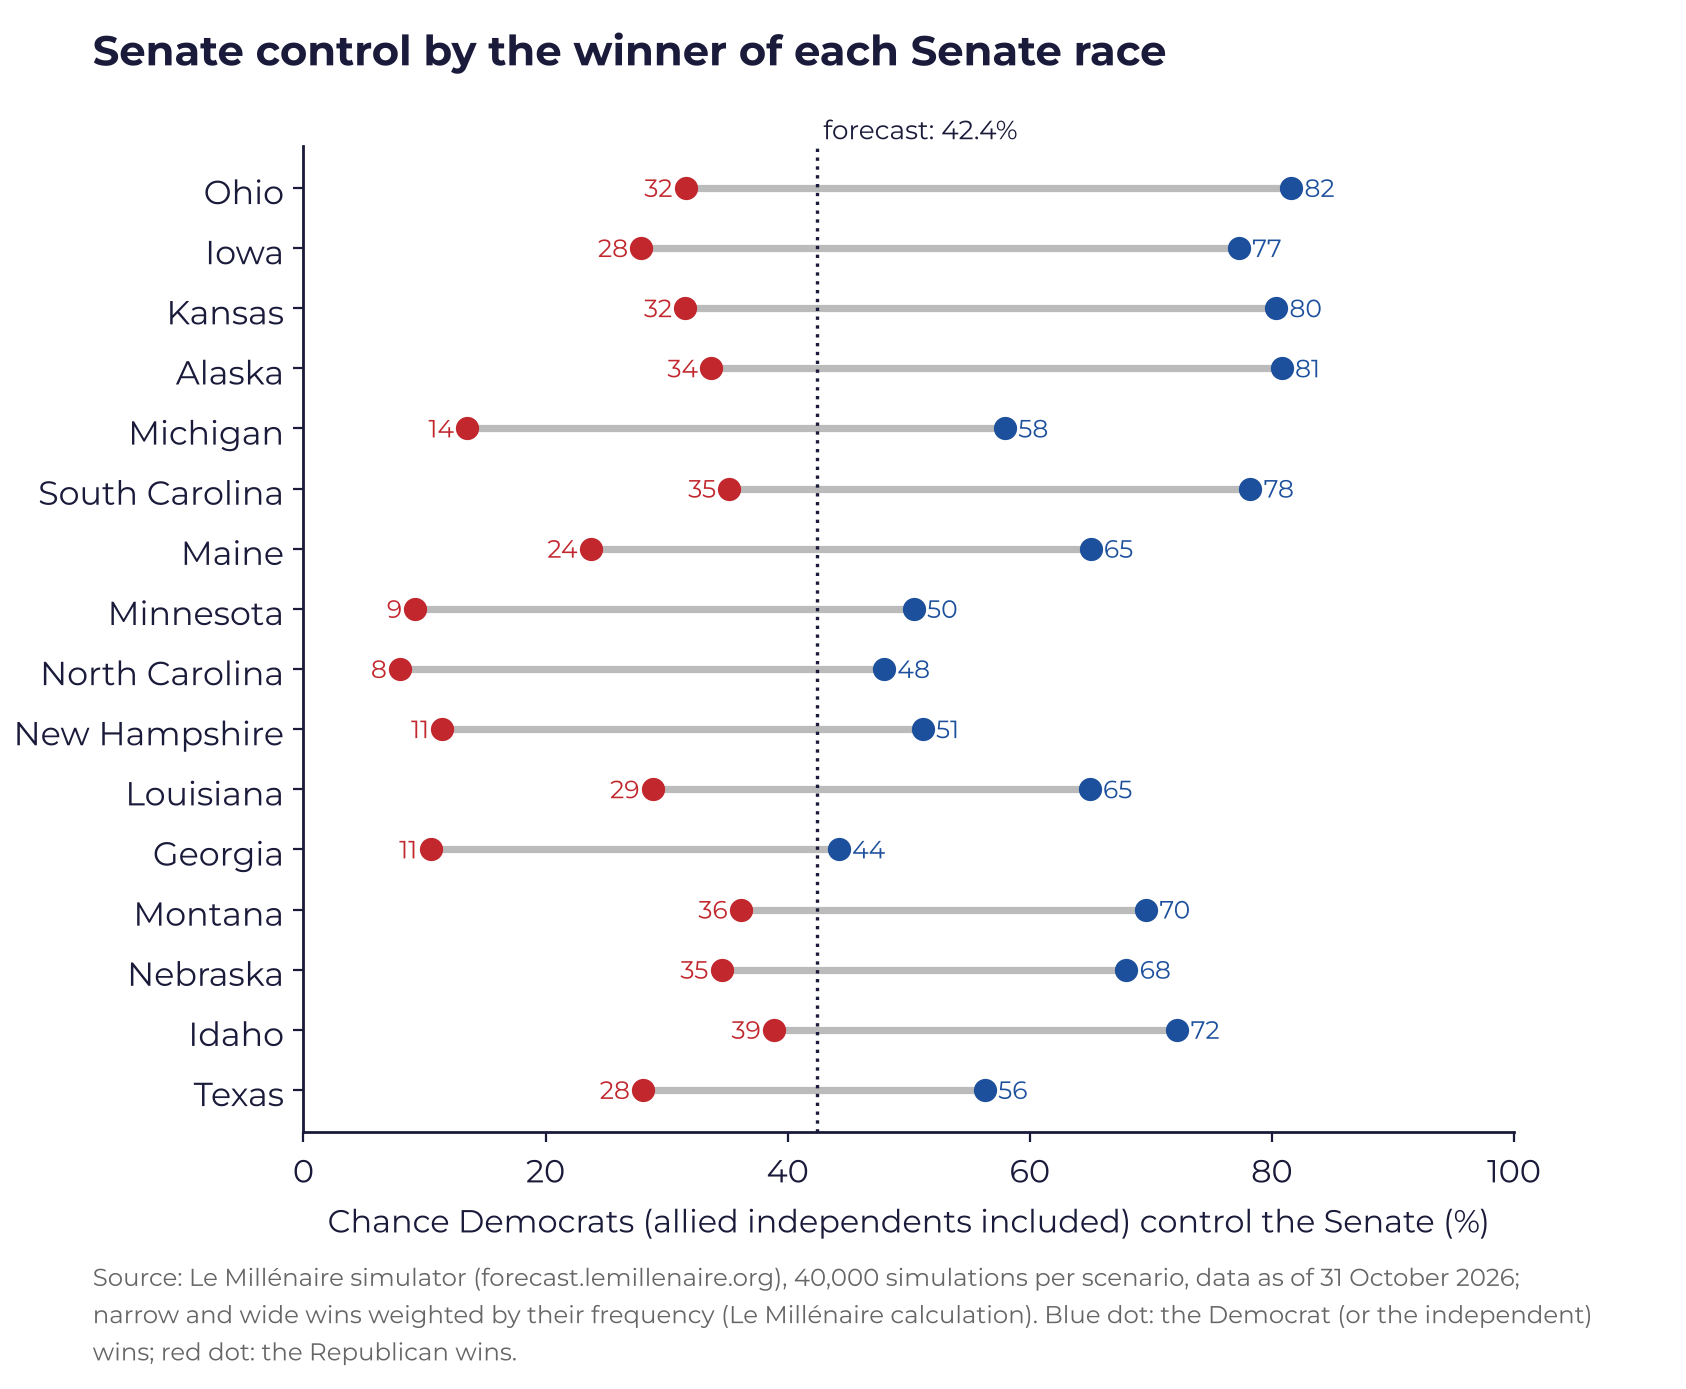
Where the Democrats are favored, a win leaves their Senate chances between 44.2% and 57.9%, while a loss drops them to between 8.0% and 13.5%. Where the Republicans are ahead, a Democratic win lifts them to between 64.9 and 81.6%. Texas and Maine are the two toss-up races: a win in either one already lifts Democratic chances to between 56.3 and 65.0%, and the third would come from Louisiana, now the tipping-point race, or from the Midwest and the Plains, where Iowa would be the most obvious candidate. Everything also starts with Ohio: a Brown win, even a narrow one, lifts Michigan to 80.8%, Texas to 57.6% and Maine to 57.1%.
The independents. Dan Osborn, Seth Bodnar, Brian Bengs and Todd Achilles carry Democratic hopes where the party is standing aside, but none of them promises to caucus with the Democrats. “I’d caucus with everybody… Independent means independent,” Osborn declared. Republican chances remain at 57.6% or higher under every assumption, and in 9.9% of simulations the majority would be decided by the vote on the organizing resolution, in a negotiation with one or two senators outside any caucus.
And if the polls are wrong? With a uniform 3-point error in the Democrats’ favor, their Senate chances would rise to 72%; in the other direction, they would fall to 14.8%. The errors of 2016, 2020, 2022 and 2024 would all lower Democratic chances, down to 6.6% for 2016.
Our analysis. After the 2.33-point correction drawn from past errors, our model concludes that the Senate will be Republican with 50 or 51 seats.
At 12 points, Ossoff’s margin would confirm the polls. At 3 or 4 points, it would signal Democratic trouble in Texas, Maine and the Midwest.
The night of November 3
In Georgia and North Carolina, our projections show Democratic leads of 11.7 and 7.8 points. That is where the margin will measure the polling error. If it holds, Texas, Maine and Ohio become winnable. If it falls below 5 points, the simulator brings Democratic Senate chances back below 30%.
In Ohio and Iowa, the result will show whether the white working-class electorate, which delivered Trump’s victory in 2024, has partly returned to the Democrats. A Husted win by more than 5 points would bring Democratic chances down to 24.0%, and a Hinson win of the same size to 19.9%.
If the Democrats won Texas and Maine while holding all their seats, they would still be one seat short, which would be decided in Alaska or in a negotiation with an independent from Nebraska or Montana. The majority might then not be known on the night of November 3.
Brazil, October 25: the polls and our own model underestimated Lula by about 2.7 points in the runoff, and he won. Nothing indicates that the American error will run in the same direction. The projection already takes 2.33 points away from the Democrats. In the U.S. Senate, they start from 42.4%. The answer will come on November 3, or in the days that follow.
Le Millénaire’s four Midterms 2026 notes
Midterms 2026: The Keys to the Vote
The general note: what is at stake on November 3, how the forecast works and six tipping mechanisms.
Read the note →House of Representatives 2026: District by District
The 53 districts that decide the majority, from Pennsylvania’s 8th to the Rio Grande Valley.
Read the note →Senate 2026: Race by Race
The fifteen competitive races and the Democrats’ path to the 51st seat.
You are reading this noteGovernors 2026: State by State
The 36 offices at stake, from Wisconsin to Ohio, and what they say about 2028.
Read the note →Thay W., Scull S., Bataille A., “Senate 2026: Race by Race”, Le Millénaire Note, November 1, 2026, lemillenaire.org.
Browse the note
William Thay, Sean Scull and Augustin Bataille
President of Le Millénaire; United States specialist at Le Millénaire; Analyst at Le Millénaire.
William ThayRequest an interview
For an interview with William Thay, Sean Scull or Augustin Bataille about this note: presse@lemillenaire.org
Contact the press officeKeep our studies going
Your donations and memberships fund Le Millénaire’s next notes.
Support us JoinReceive Le Millénaire’s next briefing notes
Read also
All studies 21 octobre 2026Midterm 2026 : vers la fin du mouvement MAGA ?
 17 avril 2026Sean Scull pour Nouvelle Revue Politique : « Négocier ou escalader : ce que révèle la politique erratique de Trump en Iran »
 30 mars 2026Quand les démocrates se cherchent leur Trump
 5 février 2026Sean Scull pour Valeurs Actuelles : « Mais que va faire Donald Trump jusqu’à la fin de son mandat ? »
