
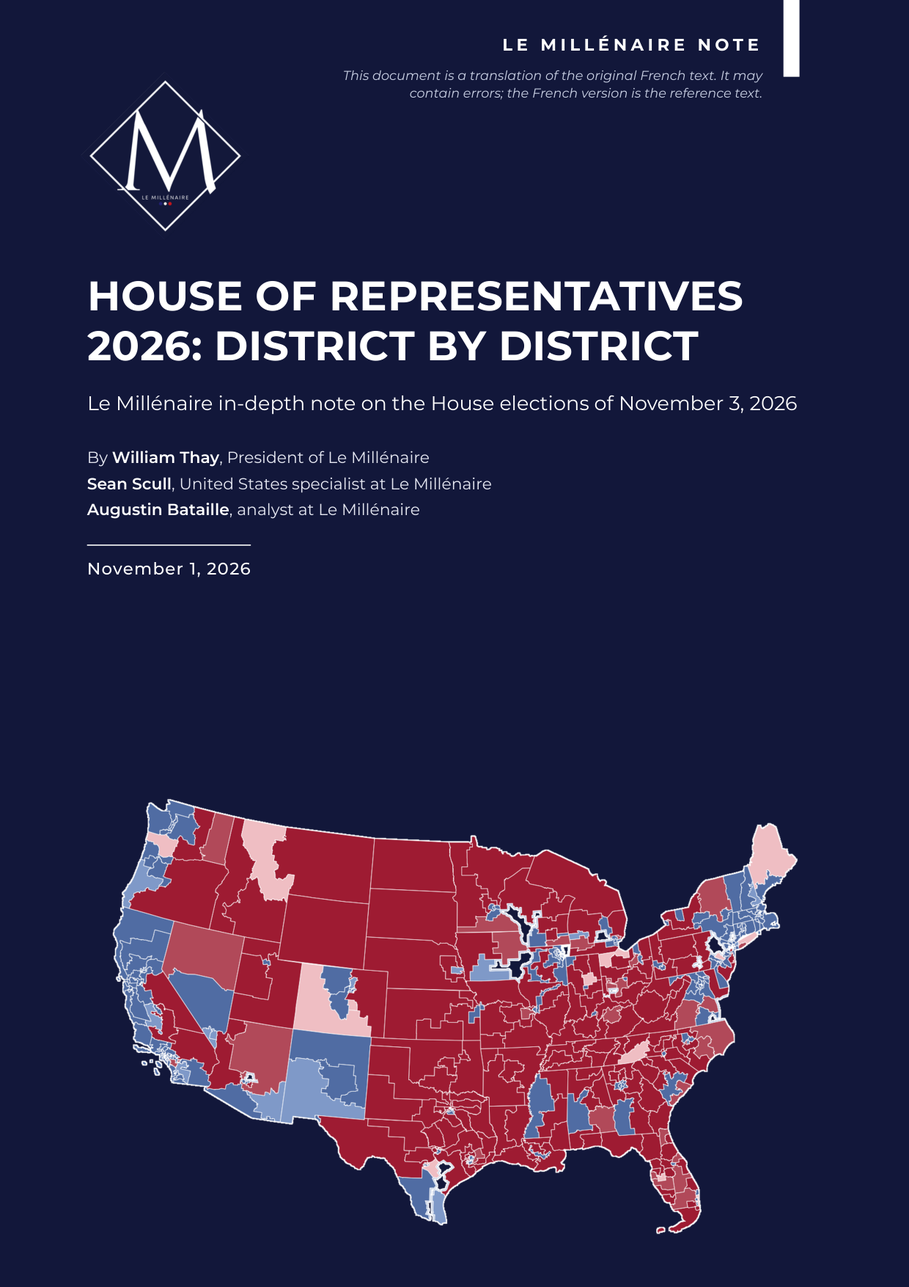
This page is a translation of the original French text. It may contain errors; the French version is the reference text: Chambre des représentants 2026 : district par district
Le Millénaire in-depth note on the House elections of November 3, 2026
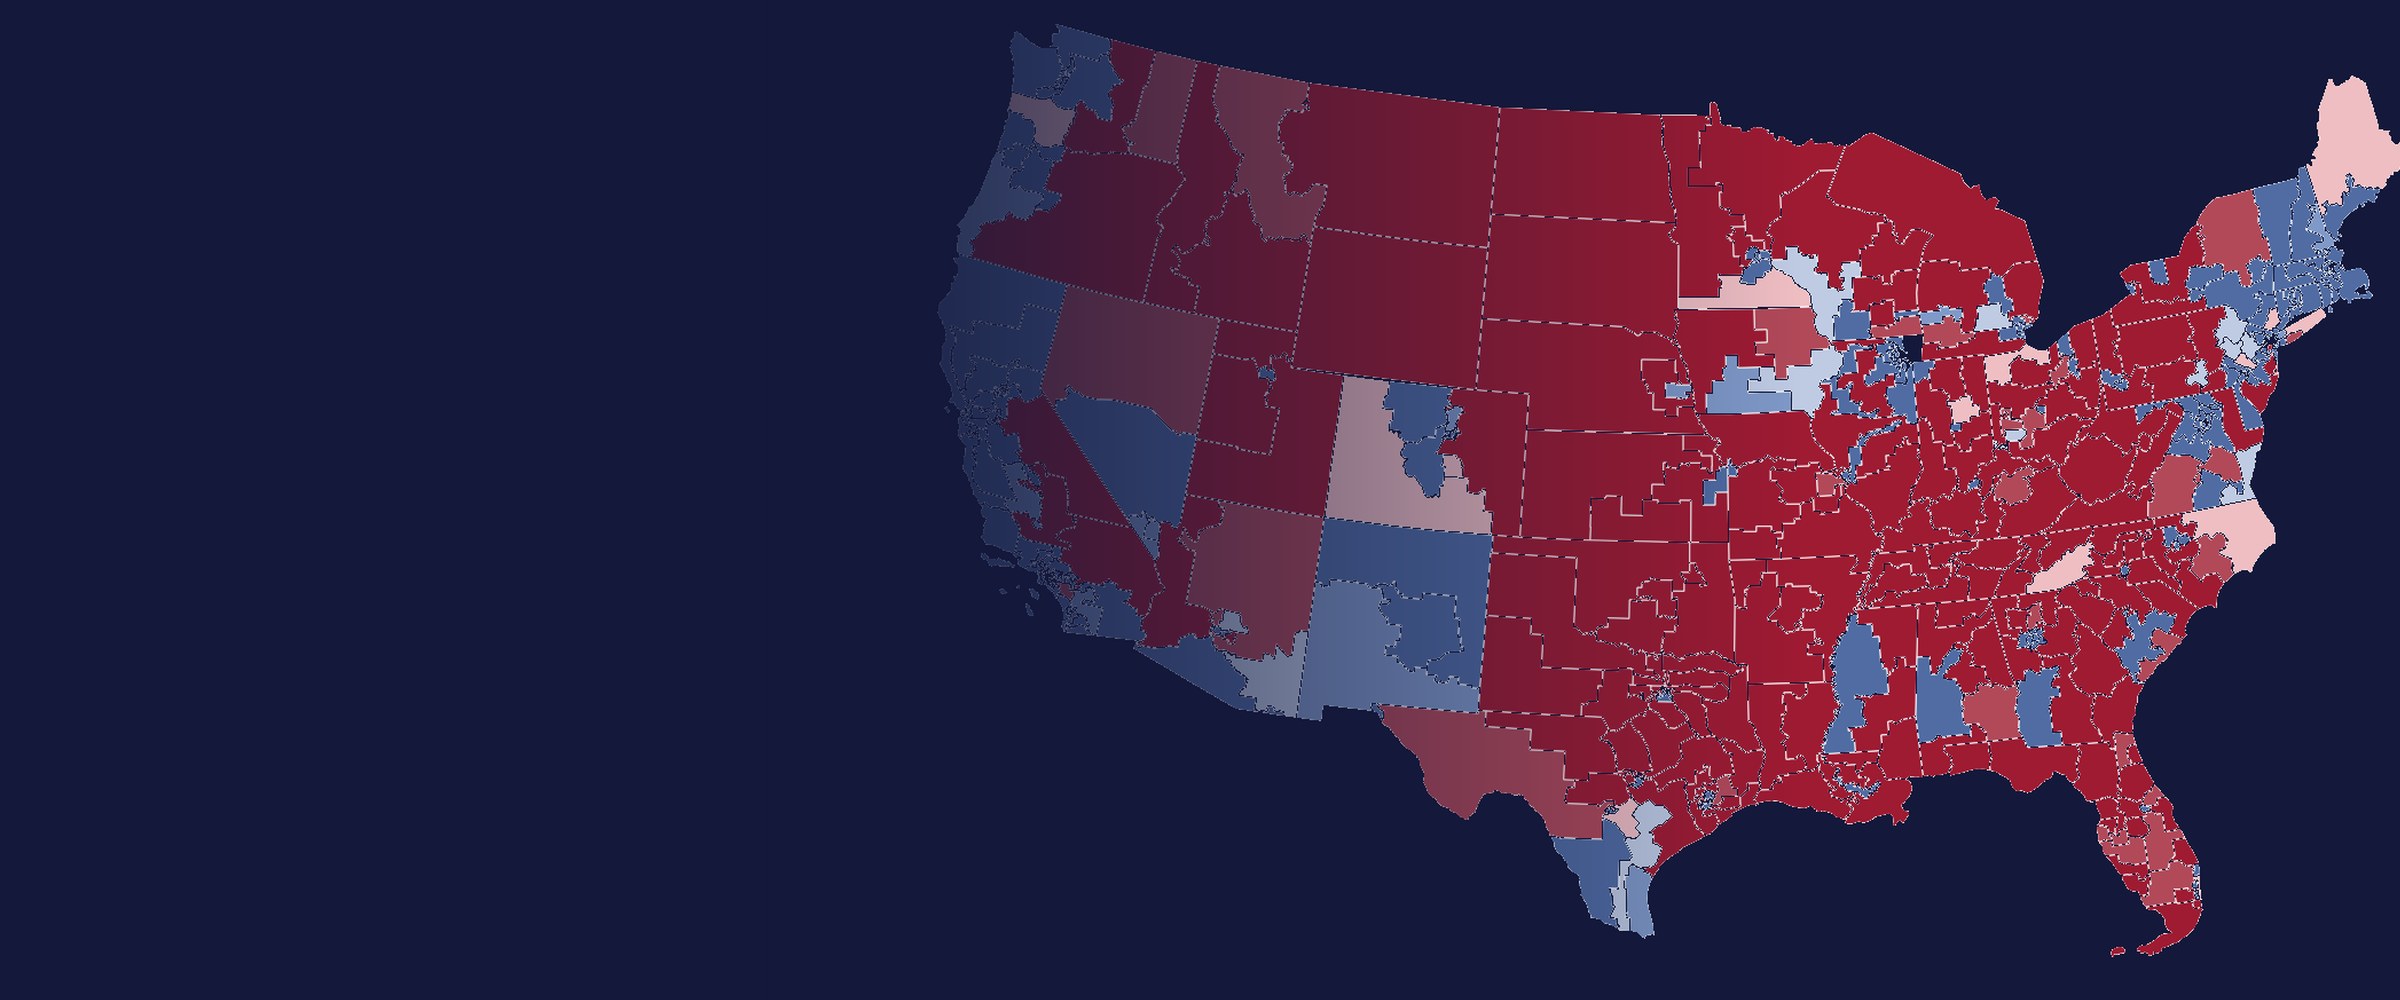
Arizona’s 1st district: Donald Trump won it by 3.1 points in 2024, and our projection gives the Democrats a lead of only 2.0 points there. That is where the 218th seat would be decided. Yet the Democrats have a 78.1% chance of winning back the House, despite redistricting that took safe seats away from them. William Thay, Sean Scull and Augustin Bataille follow the majority district by district.
A likely majority
The Democrats have a 78.1% chance of winning back the House, up from 65.5% on August 1. We expect 228 Democratic seats, within a range of 207 to 252, for a majority set at 218.
The national environment
The national environment is worth about 3 points of Democratic share in each district. It is what makes the Democrats favorites in the suburbs Trump narrowly won, far more than district polls, which are scarce and often partisan.
The redistricting gamble
Mid-decade redistricting costs the Democrats safe seats in Texas, Florida, Ohio and North Carolina. It also creates toss-up districts with large Latino populations, where we will see whether the 2024 swing holds.
Foreword
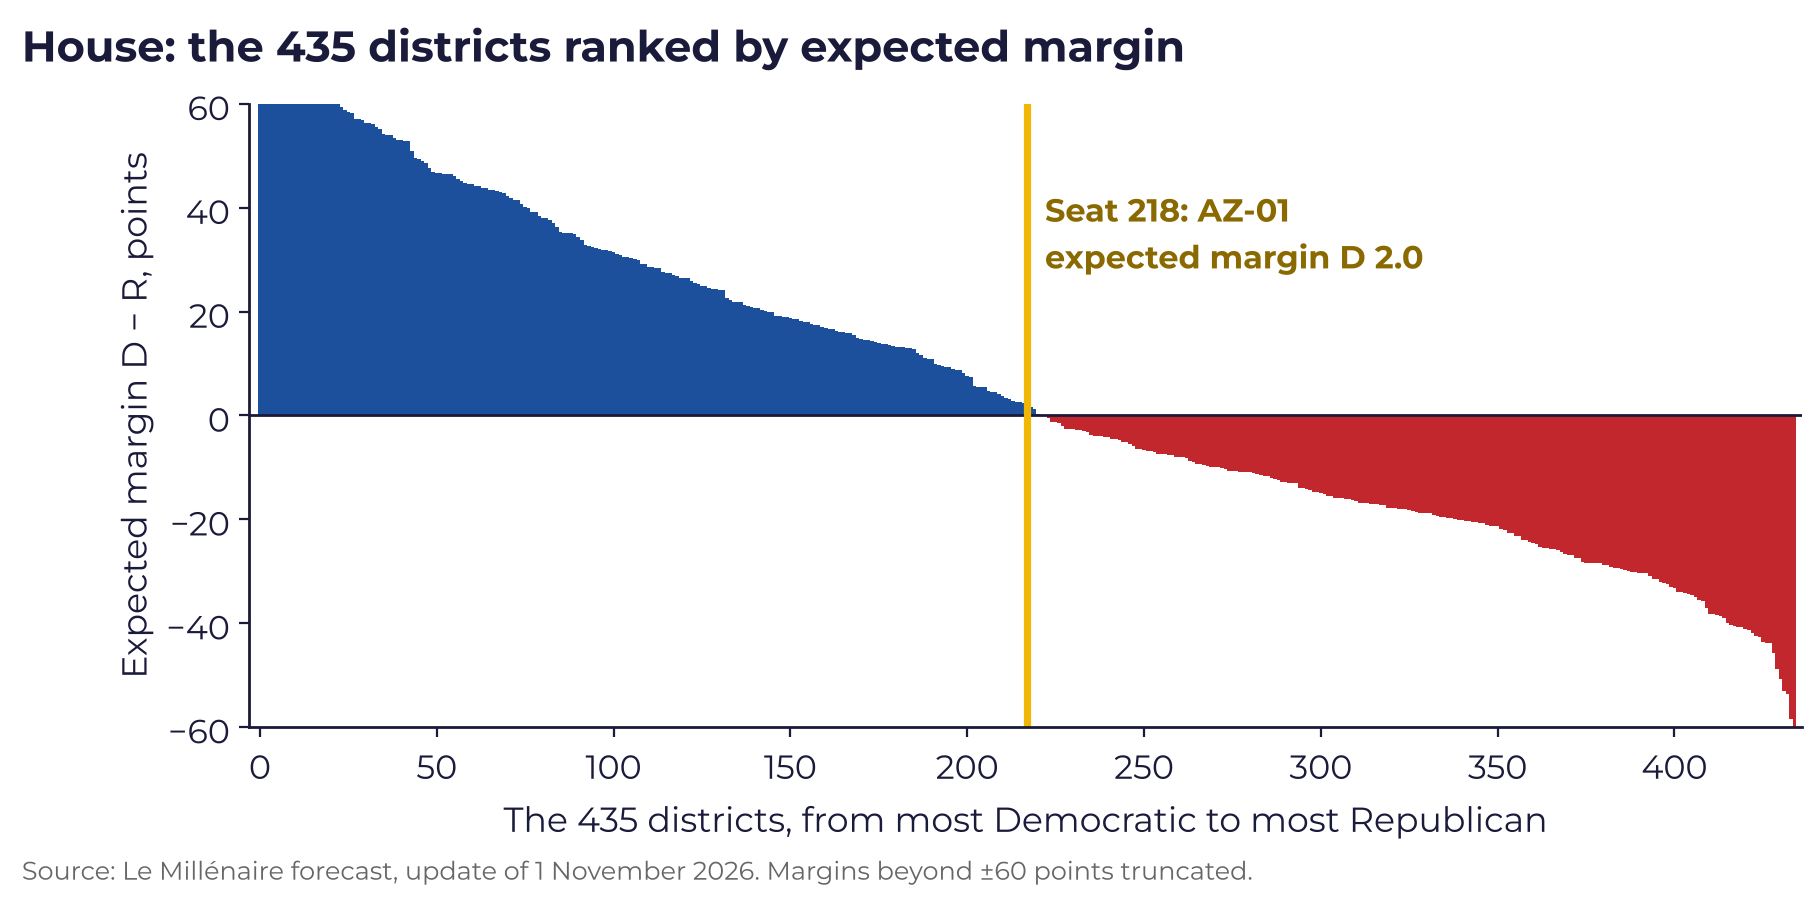
Arizona’s 1st district: Donald Trump won it by 3.1 points in 2024, and our projection gives the Democrats a lead of only 2.0 points there. That is where the 218th seat would be decided, if they won every district in which they are favored and lost all the others. Yet the Democrats’ chance of winning back the House reaches 78.1% as of November 1, up from 65.5% on August 1, despite mid-decade redistricting.
The question we will ask is the following: in which districts will the majority be decided, and why? To answer it, we cross-reference the Le Millénaire forecast with the 2020 and 2024 presidential results recomputed on the 2026 lines, the reports filed with the Federal Election Commission and district polls, cited with their sponsor.
First comes the national picture: chances of a majority, the rating of all 435 seats, the new maps. Second, we follow the suburbs and mid-sized cities that make the majority. Third come the Democratic seats to defend and the Republican seats that have been redrawn or have no incumbent. The figures come from the November 1, 2026 update of the forecast, with 200,000 simulations; our interpretations are in the “Our analysis” sections.
A likely Democratic majority, but not a done deal
Republicans hold 218 seats, Democrats 214. The Democrats therefore need four more, net. The model gives them a 78.1% chance of getting there. It expects 228 seats, within a range of 207 to 252 in 90% of the simulations. A national polling error, however, would move dozens of districts in the same direction at once.
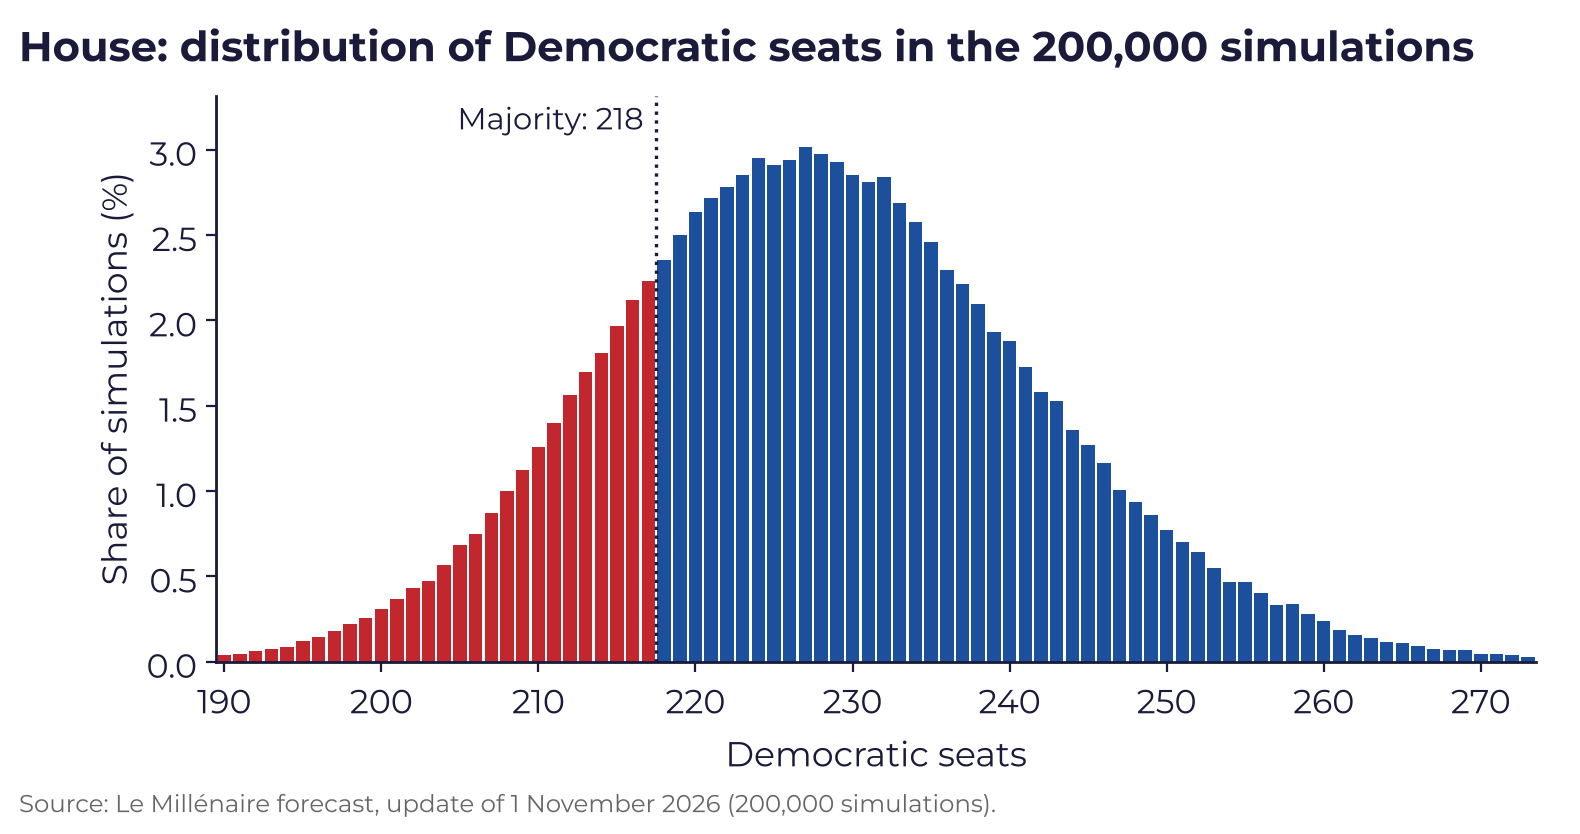
On August 1, it was a 65.5% chance and 222.8 expected seats. Since then, the Democratic lead in our average of the generic ballot, voting intention for a party in the House, has grown from 6.1 to 7.2 points. Each point gained has moved a few districts from “Lean R” to “Toss-up,” others from “Toss-up” to “Lean D.”
How our model projects a district
For each of the 435 districts, the model starts from the 2024 presidential vote, recomputed on the 2026 lines. It then adds the local gap, that is, the district’s tendency to vote more or less Democratic for the House than for president, where the incumbency advantage is captured; campaign fundraising and outside spending; district polls, where they exist; and finally the national environment.
The model keeps only polls whose fieldwork ended within the last 21 days, with one wave per pollster. Polls sponsored by a campaign, a party or a committee are kept, but corrected for their average bias, and the average is further reduced by 2.31 points, the national correction for the historical polling error. Tested on the elections from 2014 to 2022, the rule produces breaks when polls are scarce: a district’s projection can shift markedly on the day its only poll drops out of the window.
The national environment adds about 3 points of Democratic share to each district, or 6 points of margin. With this block, a district that Donald Trump won by about 6 points in 2024 starts out even before any local effect. It also weighs more than everything else in the uncertainty: with a neutral environment, twenty districts now projected Democratic would go back to the Republican side.
The settled races, and why they are settled
Of the 435 districts, 308 are rated “safe” by our model, with one party above a 95% chance. The 137 safe Republican districts were all won by Donald Trump by at least 14.2 points, and the 171 safe Democratic districts were all won by Kamala Harris. To flip one of them would take an error of nearly 15 points of margin, more than triple the largest generic ballot error in the last five midterm elections.
Twelve districts safe for the Democrats were nonetheless won by Harris by less than 8 points. Their incumbents run ahead of their party’s presidential candidate: in Kansas 3, Harris led by only 4.2 points, and our model projects Sharice Davids at 59.6%. In 27 of the 50 states, no district offers either party between a 25 and 75% chance; nine states alone account for 33 of the 53 districts analyzed here.
Mid-decade redistricting: what it gains, what it costs
Republican states redrew their districts without waiting for the 2030 census because Donald Trump asked them to. California retaliated in the opposite direction, by referendum, with Proposition 50. In all, nine states are voting on new maps. On paper, the balance is a net Republican gain of about nine seats; Erin Covey of the Cook Political Report expects a net gain of about three seats.
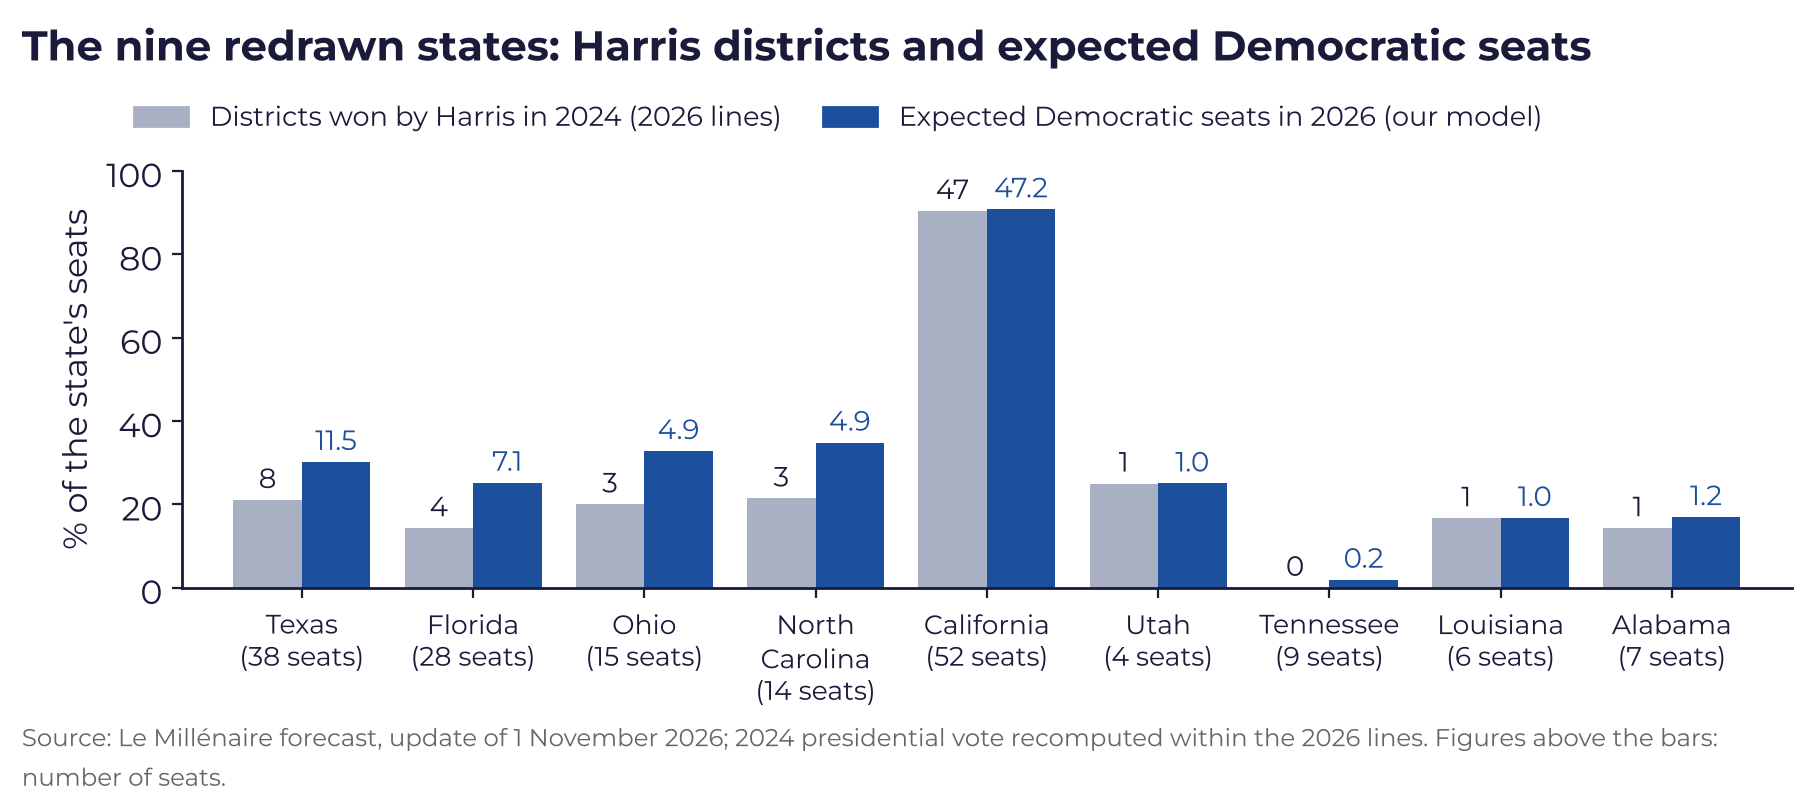
In Texas, Kamala Harris would have won only 8 of the 38 redrawn districts, whereas we expect 11.5 Democratic seats there; in Florida, 4 of 28, for 7.1 expected seats; in Ohio, 3 of 15, for 4.9. To maximize the number of seats, Republican mapmakers stretched their advantage across as many districts as possible and created districts won by Trump by 9 to 12 points, which would be Republican in a neutral year but become competitive in a year when the national environment adds 6 points of margin to the Democrats.
Most of these districts have large Latino populations, precisely where the 2024 vote had swung most, and our model treats that swing as a given. If it has partly faded, the Democrats could do better than expected there; if it has held, redistricting will have achieved its aim.
The 53 districts that make the majority
We selected 53 districts for detailed analysis, those where Democratic chances stood between 20 and 80% at the time of selection, plus a few districts that draw the attention of the American press or present a particular feature.
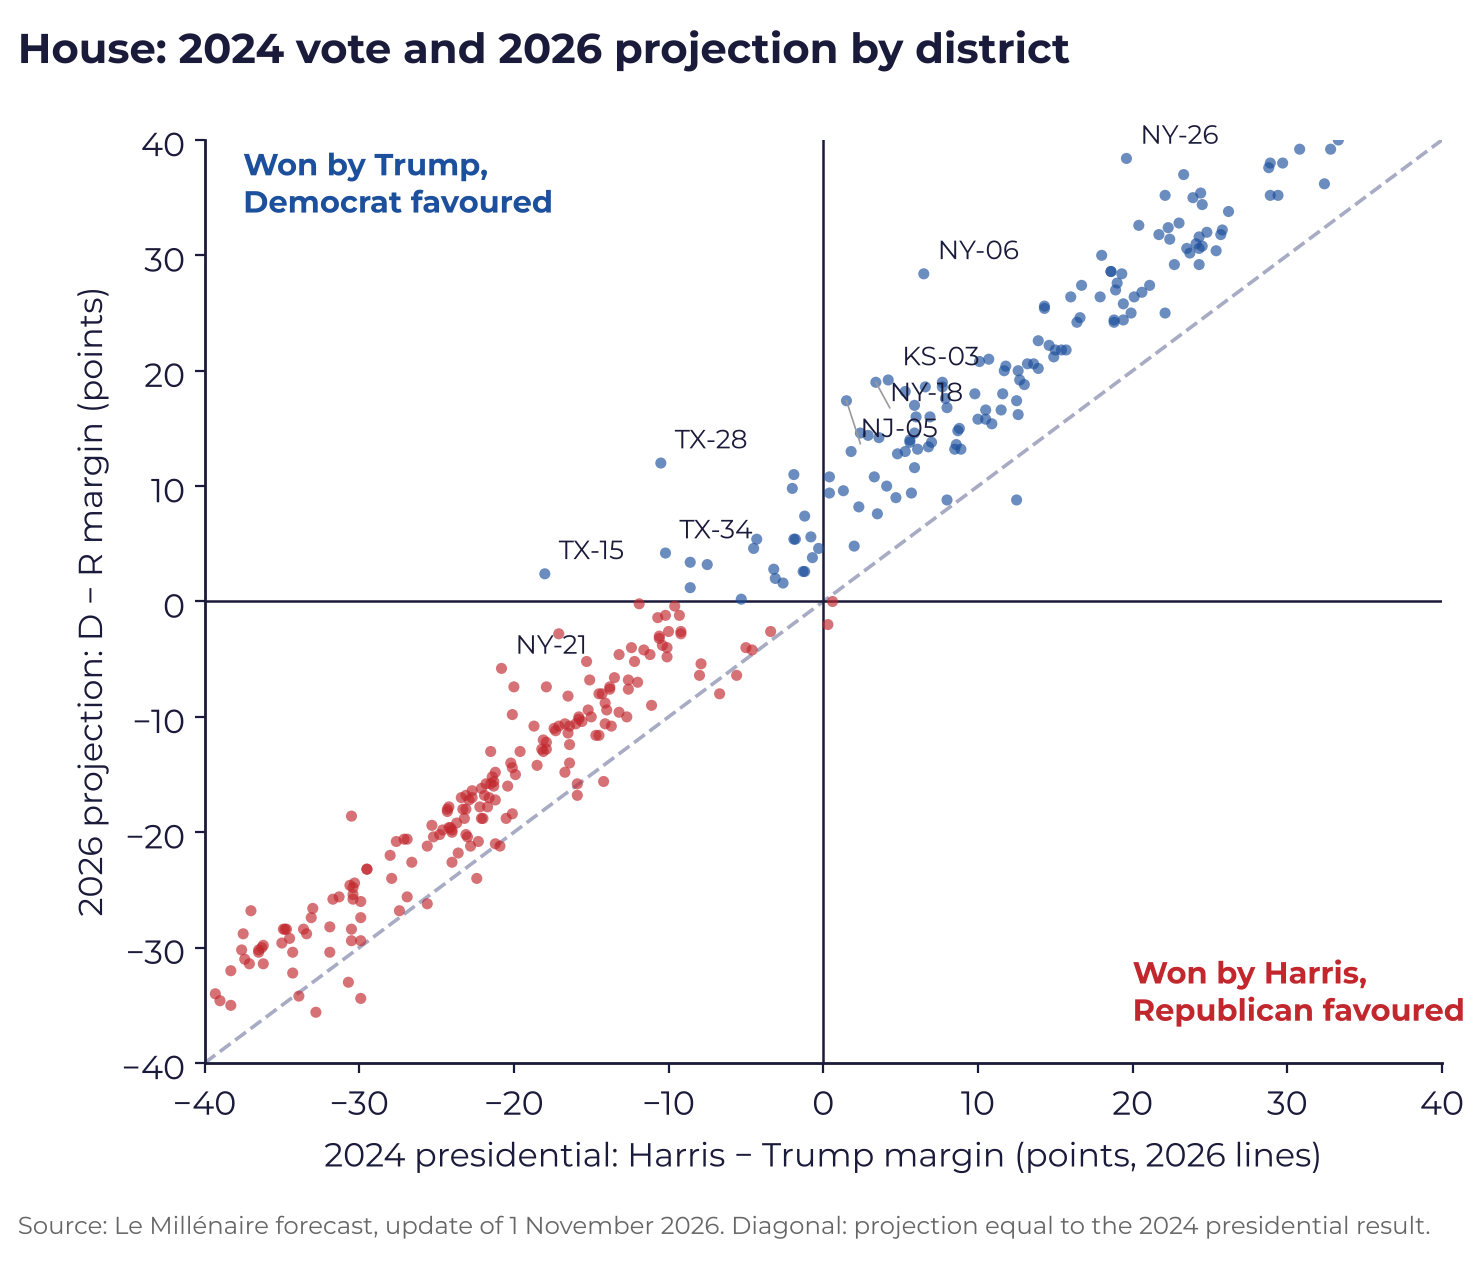
Almost all districts sit above the diagonal, our projection being more Democratic than the 2024 presidential vote by 6 points of margin on average, which corresponds to the national environment. The exceptions are districts where a popular Republican incumbent or heavy Republican spending offsets that environment, such as Pennsylvania’s 1st district.
Our analysis. Even if they lost all the redrawn Latino districts in Texas and Florida, the Democrats would keep the advantage, since their majority is built in some twenty suburban districts that Trump had won by one to five points, provided the national environment holds. According to our “Polling errors” tool, a 2016-style error would bring them down to 75.9%, a 2020- or 2024-style error to 16.9% or 16.7%.
Follow the forecast until November 3
The figures in this note come from Le Millénaire’s forecast: 200,000 simulations of the election, updated every day until the vote. There you will find each party’s chances, the projection for every race and the simulator, which lets you set the winner of one race and recalculate the rest of the map.
Hover over or tap the map to see, race by race, each party’s chances and the forecast projection as of November 1, 2026, the date of the figures in this note.
PA-08: Paige Cognetti vs. Rob Bresnahan
Of the Pennsylvania districts that Democrats are favored to win, the 8th is the most favorable to Donald Trump, who won it by 8.6 points. Yet Paige Cognetti leads there in our model, with a 1.1-point lead and a 55% chance, thanks to the legacy of former Democratic member Matt Cartwright and to the national environment. Lackawanna, Scranton’s county, swung sharply toward Trump in 2024.
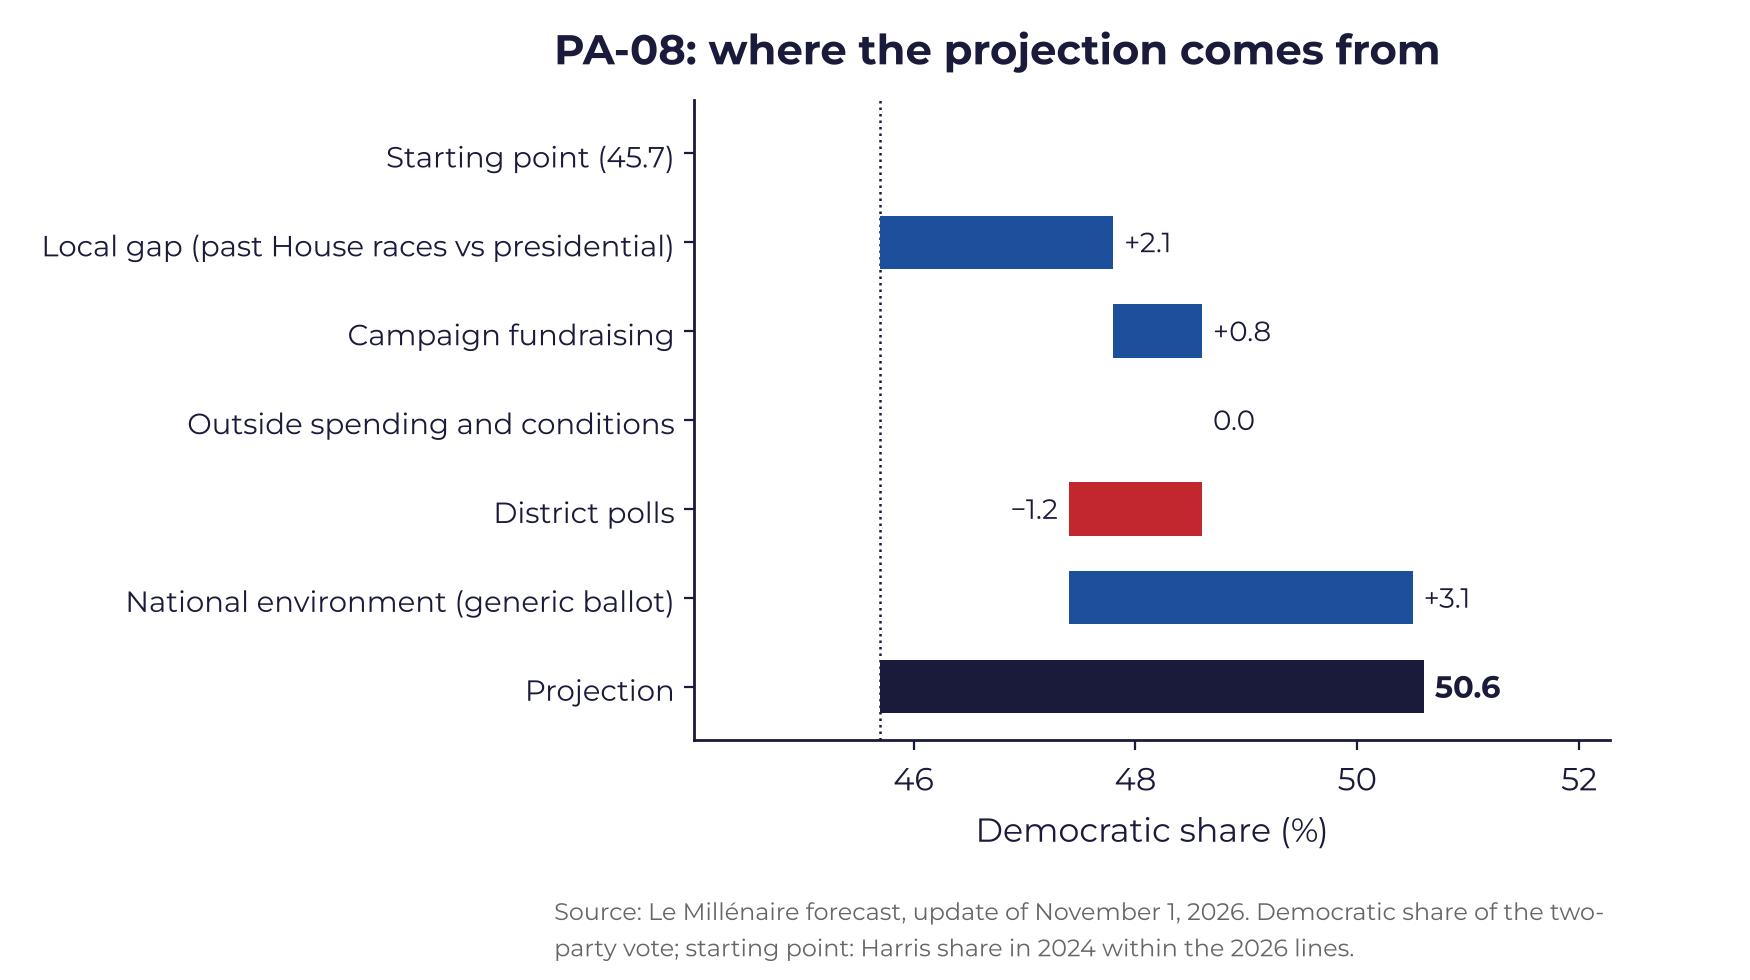
As mayor of Scranton, Cognetti brought the city out of “financially distressed” status; money tilts toward her, by more than three to one. Two polls now enter the projection, NYT/Siena’s and RedBox Research’s, the latter commissioned by a group classified as Democratic. Both put her ahead, by 5 and 3 points, but once corrected, they leave her less than the structure does, and her chances fall from 65% to 55%.
Our analysis. Is the white working-class vote of northeastern Pennsylvania returning to the Democrats without Donald Trump on the ballot? The October polls suggest so. Yet Cognetti has never run here before, and the 2.1 points of local gap come from Cartwright’s wins. A Republican lead in Luzerne cut below 15 points, compared with 19.2 in 2024, would in our view be a strong signal.
PA-01: Bob Harvie vs. Brian Fitzpatrick
Brian Fitzpatrick would hold the seat according to our model, with a projected lead of 2.0 points and a 41% chance for Bob Harvie, in a district won by Kamala Harris. The incumbent has long run ahead of the Republican presidential candidate, and that premium on its own wipes out the national environment. A former FBI agent, he voted against the “One Big Beautiful Bill,” and Donald Trump does not endorse him.
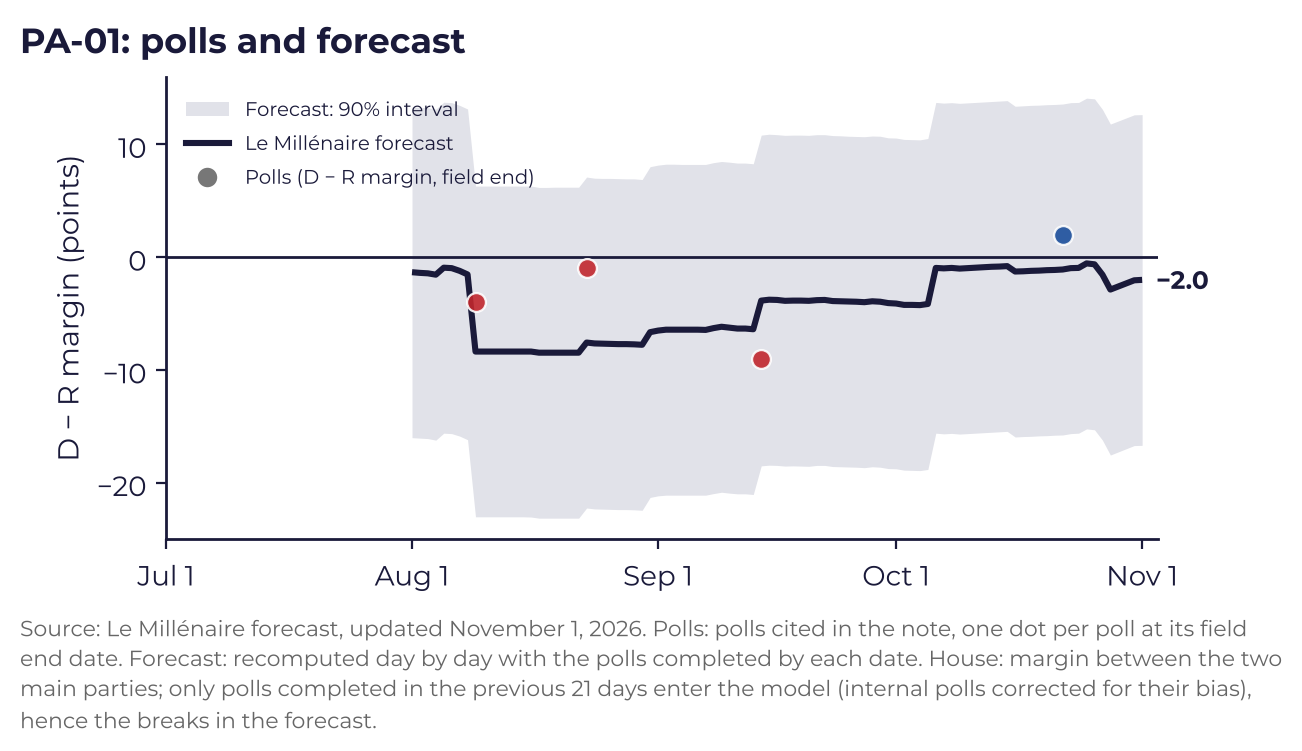
The latest poll, Siena’s, has Harvie ahead instead, 48% to 46%. Taken in isolation, it would have flipped the favorite according to our calculation. But RedBox Research’s poll, commissioned by a group classified as Democratic, finds a tie at 46%; once corrected, the two polls pull the projection toward Fitzpatrick. The race remains a toss-up.
Our analysis. Will this premium withstand an environment unfavorable to his party? We think so, even if the Siena poll suggests it is eroding. On November 3, Bucks will be the place to watch: Harvie wins if he surpasses Harris’s score there.
The toss-ups of the East and the Midwest
PA-10. Narrowly beaten in 2024, Janelle Stelson faces Scott Perry again. With the Susquehanna, NYT/Siena and RedBox polls, the race has become a toss-up again, and the projection now says so: the model still has her as the favorite, by a hair (51%). Cumberland, the only county in the area that moved toward the Democrats in 2024, will give the signal.
NY-17. Kamala Harris won the district, but Mike Lawler ran 6 points ahead of Trump in 2024, and a recent poll, commissioned by a Democratic group, pulls the projection toward him. Cait Conley remains the favorite, but only just, with a 50% chance: the race is a toss-up. Everything hinges on Rockland.
IA-03 and IA-01. Donald Trump won Iowa’s 3rd district, but Sarah Trone Garriott’s financial advantage adds to the national climate (70%). In the 1st, Christina Bohannan, who came close to winning in 2024, starts as the favorite in her third matchup with Mariannette Miller-Meeks (65%).
WI-03 and MI-07. Rebecca Cooke ran 2.4 points of share ahead of Harris in 2024; the model makes her the favorite against Derrick Van Orden (64%). In Michigan, the only independent poll in October puts William Lawrence clearly ahead of Tom Barrett; it is not in our data, and the model remains more cautious (61%).
That was Bobby Pulido’s chance in Texas’s 15th district on October 26, lacking the latest independent poll. Since it entered our data, it has been 60%.
TX-15: Bobby Pulido vs. Monica De La Cruz
Democratic in 2016, the district gave Trump an 18-point lead in 2024, and the map signed by Greg Abbott added more conservative counties. Bobby Pulido, a Latin Grammy-winning Tejano music singer, is running as a Democrat who is conservative on social issues. The five 2026 polls all put him ahead, by 2 to 13 points.
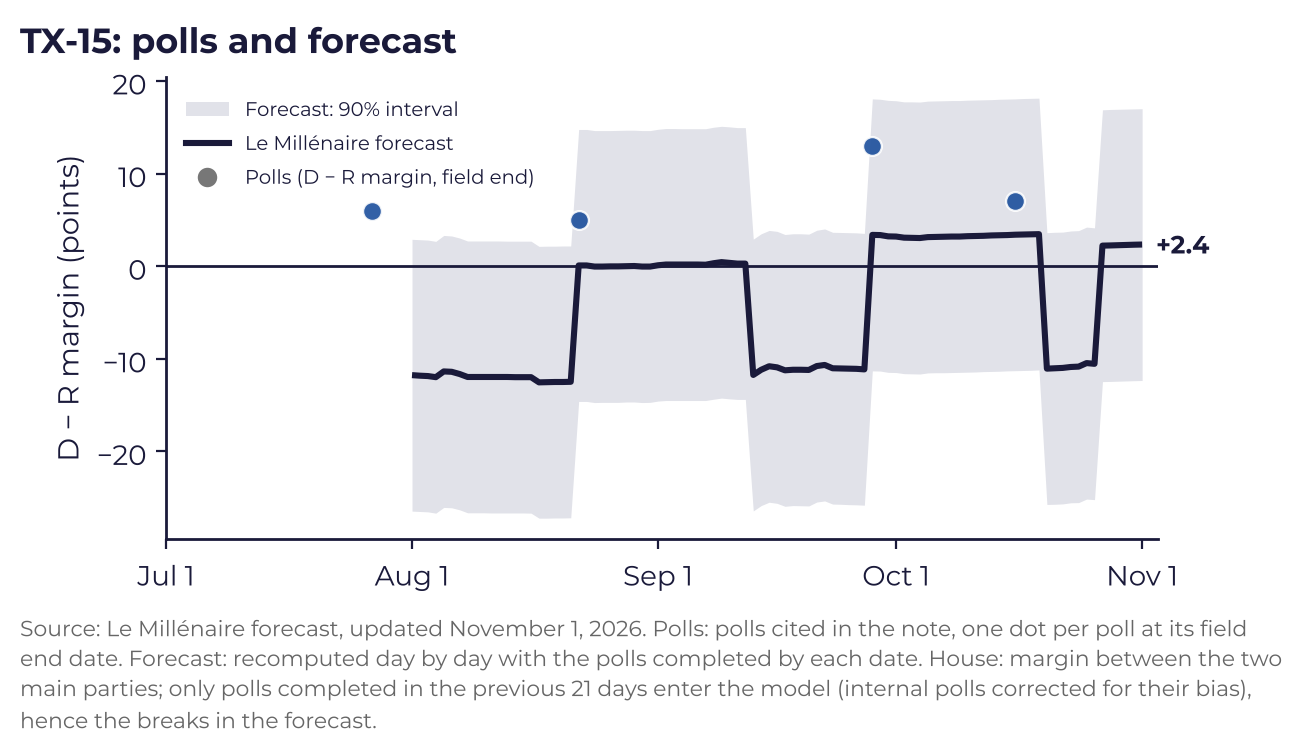
Without polls, the structural projection puts De La Cruz ahead by about 10 points. It jumps toward a tie as soon as a poll favorable to Pulido enters the 21-day window, and falls back when it leaves. The Texas Southern University poll, released on October 21, puts him ahead by 7 points, and 57 to 40 among Latino voters; not in our database as of October 26, it has since been added: its margin falls to 5.5 points after adjustment and leaves Pulido ahead by 2.3 points.
Our analysis. We consider Pulido a slight favorite, and the model now puts him ahead too, with a 60% chance. He is the type of candidate capable of winning back part of the 2024 vote. Hidalgo will be decisive: if he gets back to a lead there close to Biden’s in 2020, he will win.
NY-21 and NC-01: when a poll drops out of the window
NY-21. In a district Donald Trump won by 20.8 points, the model gave the edge to Democrat Blake Gendebien until October 26, on the strength of a single poll, Siena’s. That poll dropped out of the window on October 28, and Anthony Constantino is now the favorite, with a 74% chance. Six of the eight polls have Constantino ahead, including those from Gendebien’s own side. We expect instead a Republican win by a few points.
NC-01. The district was redrawn so that Trump would have won it by 11.6 points. Don Davis was nonetheless the favorite in our model on October 26, thanks to two polls from Republican pollsters, adjusted in his favor, which dropped out of the window on October 28 and 30. Only one more recent poll remains, less favorable to Davis, and Laurie Buckhout moves ahead (32% for Davis).
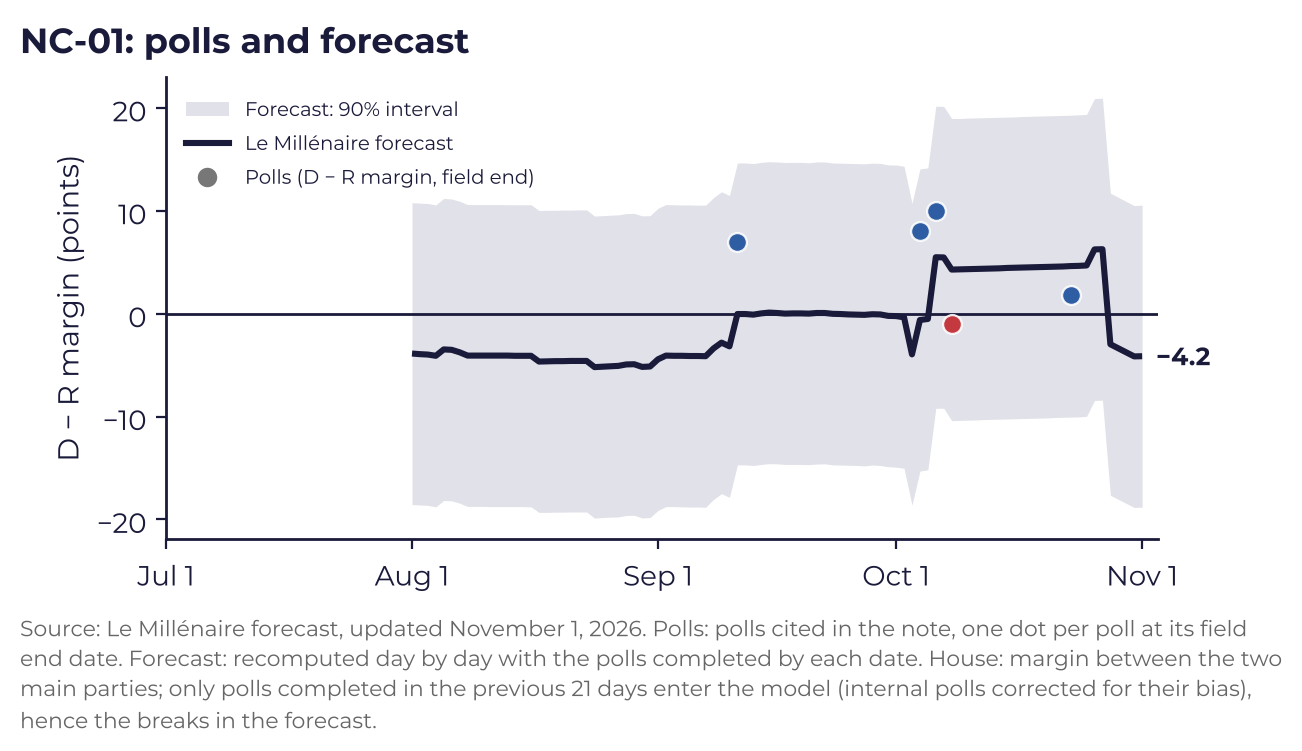
We believe Davis has a slight advantage, whereas the projection gives him only a one-in-three chance: every fall poll except co/efficient’s puts him ahead, a real signal in a district drawn to be 12 points for Trump. On election night, watch turnout in Edgecombe, Halifax and Hertford.
Democratic seats weakened by redistricting
Texas, Florida and Ohio redrew their maps for 2026, each time targeting Democratic seats, which have become districts Trump carried by 9 to 11 points in 2024.
OH-09. Marcy Kaptur faces Derek Merrin again, whom she beat in 2024, but the map has been redrawn against her, and the model gives the Republican a slight edge (43%). She will need to build a bigger lead in Lucas County than in 2024.
TX-34. The independent Washington Post poll puts Vicente Gonzalez seven points ahead of Eric Flores; since it entered the calculation, the model also gives the incumbent the edge (68%). The Latino vote is attached to Trump more than to the Republican Party; Cameron County (Brownsville) will provide the measure.
FL-25. Ron DeSantis’s map pushed Jared Moskowitz into a new, more Republican district. The race is one of the most expensive in the country, and the model gives Scott Singer a slight edge (38% for Moskowitz). We consider it a genuine toss-up.
ME-02 and Alaska. In Maine, Paul LePage, a former governor, is favored to take this open seat back, but the only university poll puts Matthew Dunlap ahead; ranked-choice voting will decide if no one reaches 50%. In Alaska, Nick Begich is the clear favorite against independent Bill Hill.
Even if they lost all the redrawn Latino districts in Texas and Florida, the Democrats would keep the advantage, provided the national environment holds.
Le Millénaire’s four Midterms 2026 notes
Midterms 2026: The Keys to the Vote
The general note: what is at stake on November 3, how the forecast works and six tipping mechanisms.
Read the note →House of Representatives 2026: District by District
The 53 districts that decide the majority, from Pennsylvania’s 8th to the Rio Grande Valley.
You are reading this noteSenate 2026: Race by Race
The fifteen competitive races and the Democrats’ path to the 51st seat.
Read the note →Governors 2026: State by State
The 36 offices at stake, from Wisconsin to Ohio, and what they say about 2028.
Read the note →Thay W., Scull S., Bataille A., “House of Representatives 2026: District by District”, Le Millénaire Note, November 1, 2026, lemillenaire.org.
Browse the note
William Thay, Sean Scull and Augustin Bataille
President of Le Millénaire; United States specialist at Le Millénaire; Analyst at Le Millénaire.
William ThayRequest an interview
For an interview with William Thay, Sean Scull or Augustin Bataille about this note: presse@lemillenaire.org
Contact the press officeKeep our studies going
Your donations and memberships fund Le Millénaire’s next notes.
Support us JoinReceive Le Millénaire’s next briefing notes
Read also
All studies 21 octobre 2026Midterm 2026 : vers la fin du mouvement MAGA ?
 17 avril 2026Sean Scull pour Nouvelle Revue Politique : « Négocier ou escalader : ce que révèle la politique erratique de Trump en Iran »
 30 mars 2026Quand les démocrates se cherchent leur Trump
 5 février 2026Sean Scull pour Valeurs Actuelles : « Mais que va faire Donald Trump jusqu’à la fin de son mandat ? »
